sync.Pool vs fresh allocation, round two: p99 under a live HTTP handler
The microbenchmark said sync.Pool was 13x faster per op. We pointed a load generator at a real net/http handler to see if p99 actually moves.
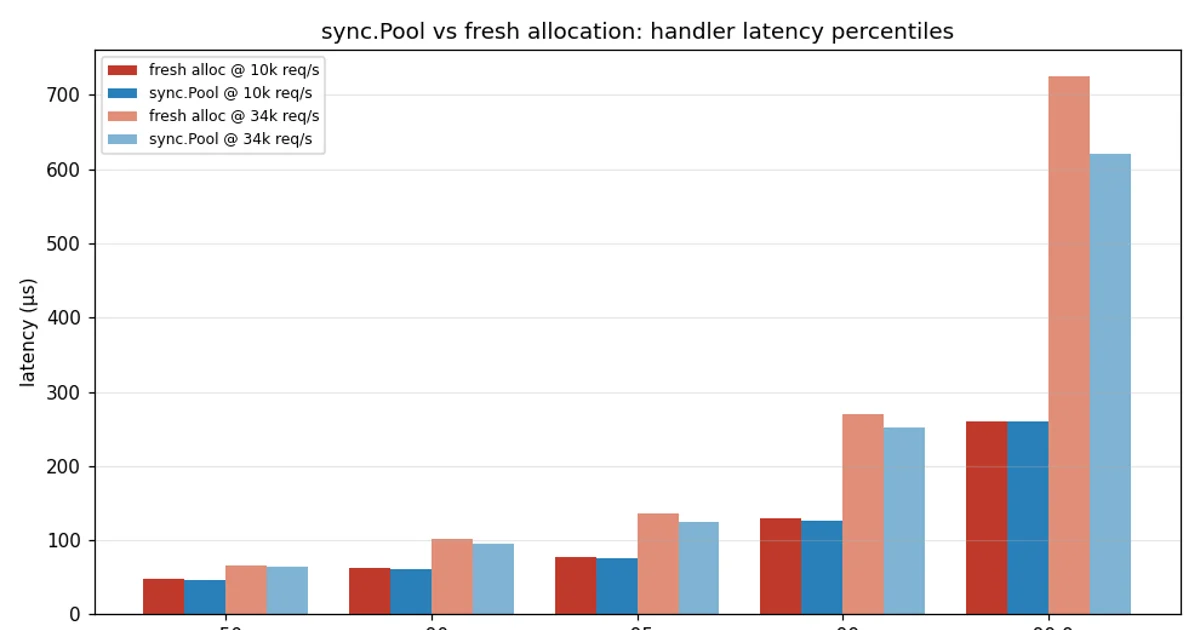
In the previous post we benchmarked sync.Pool against fresh allocation the way Go’s own tooling measures it: ns/op from testing.B. A 2 KiB scratch buffer came out 13x cheaper from a pool (≈5 ns/op vs ≈69 ns/op), and the pool removed 2 KB per op from the garbage collector’s plate.
That number is real, but it is not the number you actually optimise. Nobody ships ns/op. You ship a p99 latency budget, and you get paged when the tail — not the mean — blows through it. So this follow-up asks the only question that matters to a service owner:
Does pooling a per-request scratch buffer measurably move p99 on a live HTTP handler?
We measured it the way you’d measure it in production: a real net/http server, a real socket, a load generator, and client-side latency percentiles. Here is what actually happened.
The setup: same handler, two allocation strategies
Two otherwise-identical JSON handlers. Both walk a 32 KiB scratch buffer (we bumped it from 2 KiB so the buffer would be a meaningful share of per-request memory, not a rounding error), then marshal a small struct and write it out.
The only difference is where the buffer comes from.
1
2
3
4
5
6
7
8
9
10
11
12
13
14
15
16
17
18
var pool = sync.Pool{
    New: func() any { b := make([]byte, bufSize); return &b },
}

func handle(w http.ResponseWriter, r *http.Request, pooled bool) {
    var buf []byte
    if pooled {
        bp := pool.Get().(*[]byte)
        defer pool.Put(bp)
        buf = *bp
    } else {
        buf = make([]byte, bufSize) // fresh, every request
    }
    sink = touch(buf)              // walk it so the memory is real
    payload, _ := json.Marshal(records)
    w.Header().Set("Content-Type", "application/json")
    w.Write(payload)
}
The load generator uses an open model: it fires requests at a fixed rate (10k req/s and ~34k req/s), one goroutine per request, and records client-side latency — the number a caller actually sees. We ran 300,000 requests at 10k req/s and 1.2 million at ~34k req/s per variant, on go1.27.2 darwin/arm64.
This is deliberately the measurement the microbenchmark can’t give you: not how fast one function is in isolation, but how the whole system — scheduler, GC, sockets, kernel — behaves at the tail.
The result: the curves lie on top of each other
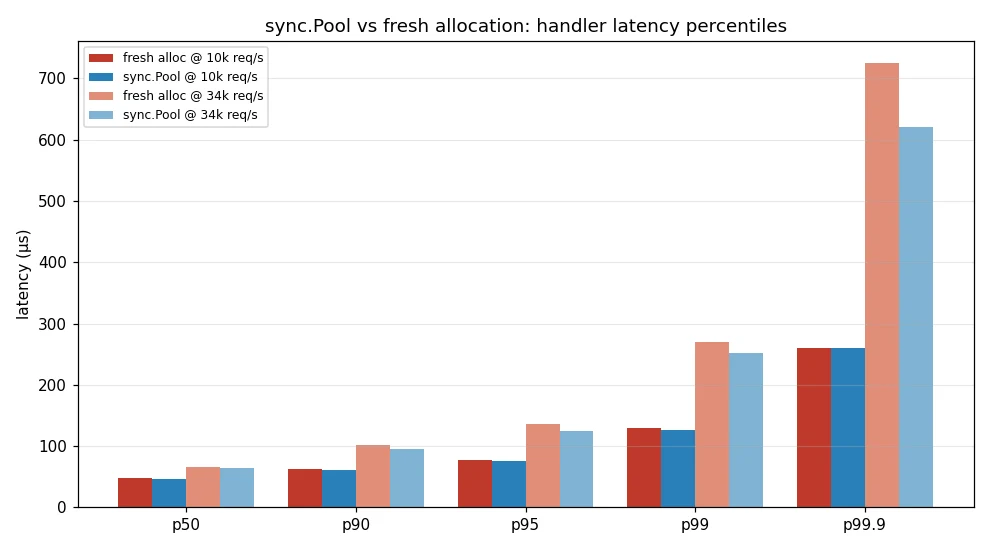
Read the numbers off the chart:
| Percentile | fresh @ 10k | pool @ 10k | fresh @ 34k | pool @ 34k |
|---|---|---|---|---|
| p50 | 47 µs | 47 µs | 65 µs | 64 µs |
| p95 | 77 µs | 75 µs | 136 µs | 124 µs |
| p99 | 130 µs | 127 µs | 270 µs | 251 µs |
| p99.9 | 260 µs | 260 µs | 725 µs | 620 µs |
The CDF makes it unmistakable. These two distributions are the same curve:
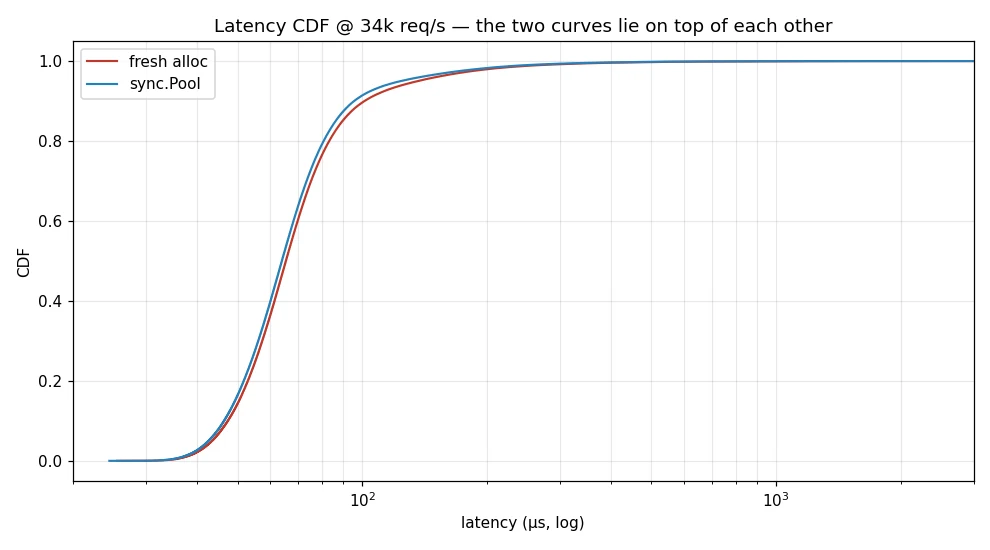
There is no p99 win. The pooled variant is a hair faster at the far tail under heavy load (620 µs vs 725 µs at p99.9), and that gap is within run-to-run noise on a shared machine.
Why the 13x microbenchmark win evaporated
This is the part that matters, and it’s the reason we ran the experiment at all. runtime.ReadMemStats tells the story. Across 1.2M requests at ~34k req/s:
- fresh: 23.8 allocations per request
- pooled: 23.8 allocations per request
The delta is −0.01 allocs/req — statistically zero. Pooling one 32 KiB buffer did not even register as a full allocation per request, because the buffer is not where the allocations are. net/http itself, the request/response plumbing, header maps, and json.Marshal already allocate roughly two dozen objects to serve a single request. Removing one of those ~24 allocations is a 4% reduction in allocation count — and the GC, which is already amortising comfortably at these rates, simply doesn’t care about 4%.
The 13x from the microbenchmark measured one operation in a vacuum, where the pooled buffer was the only thing allocating. Under a real handler, that operation is one line in a 24-line budget. Optimising the wrong line changes the average by a rounding error and the tail by nothing.
The actual lesson
This does not mean sync.Pool is useless. It means the microbenchmark and the SLO answer different questions, and you need both.
- The microbenchmark (
ns/op) tells you the cost of the mechanism — that pooling is genuinely cheaper per op, and genuinely removes memory from the GC’s path. It is the right tool for “should this hot loop pool?” - The live p99 tells you whether that cheaper mechanism is on your critical path at a share that matters. It is the right tool for “will my users notice?”
Pool a per-request scratch buffer when the buffer is the dominant allocation in the handler — a large body parser, a compression context, a render scratchpad that dwarfs the ~24 objects net/http spends anyway. Do not expect a tail-latency improvement from pooling one small buffer in a handler whose allocation profile is owned by the framework. We measured it: p99 doesn’t move.
The microbenchmark answer was correct. It was just answering a smaller question than the one your pager asks.
Methodology: Go 1.27.2, darwin/arm64. Server is net/http with a 32 KiB pooled/fresh scratch buffer; loader is an open-model generator recording client-side latency. 300k requests @ 10k req/s and 1.2M @ ~34k req/s per variant. Allocation counts via runtime.ReadMemStats. Raw percentile tables are in the chart above; the full harness is a single-file net/http server plus a ticker-based loader, ~150 lines.