AI SDLC: What the Published Evidence Actually Says About Cycle Time, Delivery Stability and Defect Rate
Six public studies on AI-assisted coding (2023-2025) compared: 21-56% faster lab tasks, a 19% slowdown for experts, worse stability and bug rates in the field.
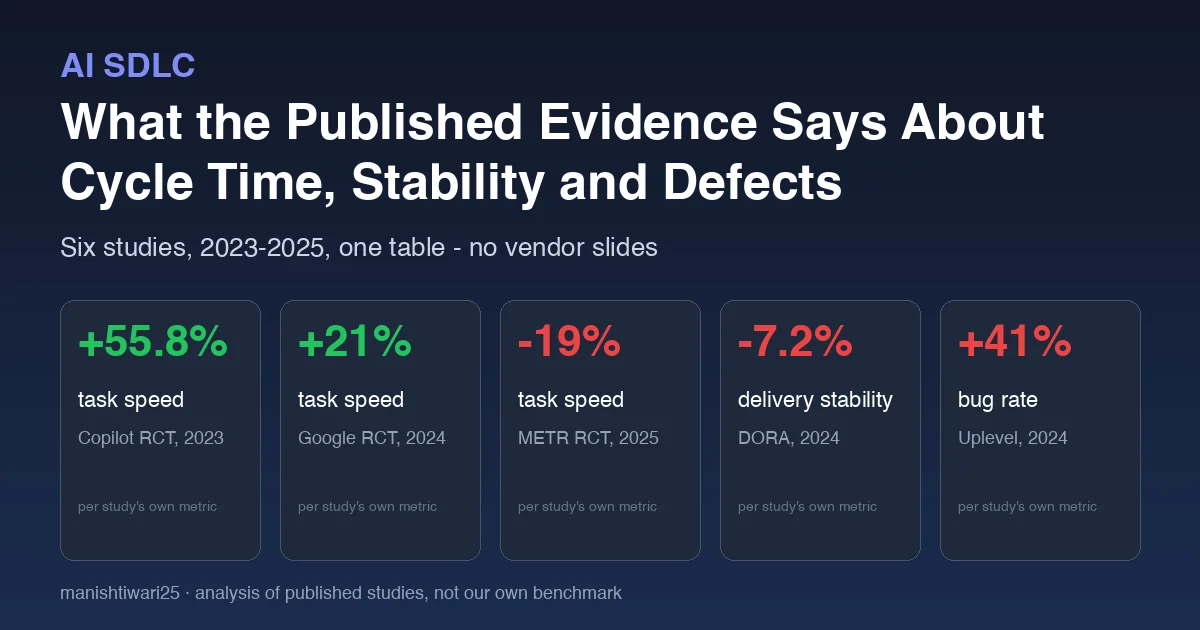
Every earlier AI SDLC post on this blog reports a number we measured ourselves on our own repositories - review-bot precision, mutation scores of agent-written tests, defect escape rate by review arm. The question I get back most often is: “Fine, but is that what everyone else sees?” This post is the answer. It is an analysis of public studies, not a benchmark I ran: six reports from 2023 to 2025, each with a real sample and a stated method, put in one table so you can see where they agree, where they contradict each other and why.
The one-sentence summary: AI assistance reliably makes a developer finish a well-specified task faster in a lab, and just as reliably fails to show up as faster or safer delivery for the team in the field - and the gap between those two findings is where your measurement effort should go.
The six studies
| Study | Year | Design | What it measured | Headline result |
|---|---|---|---|---|
| Peng, Kalliamvakou, Cihon, Demirer (GitHub / Microsoft Research) | 2023 | Randomised controlled trial, 95 developers, one JavaScript HTTP-server task | Time to complete the task | Copilot group 55.8% faster |
| Paradis et al. (Google) | 2024 | RCT, ~96 Google engineers, one enterprise-grade task | Time to complete the task | AI group ~21% faster |
| METR | 2025 | RCT, 16 experienced open-source maintainers, 246 real issues in their own repos | Time to complete the issue | AI-allowed condition 19% slower; developers believed they were 20% faster |
| DORA / Google Cloud, Accelerate State of DevOps | 2024 | Survey, ~39,000 respondents | Delivery throughput and delivery stability (four-key-metric composites) | Each 25% increase in AI adoption associated with -1.5% throughput and -7.2% stability |
| Uplevel Data Labs | 2024 | Observational, ~800 developers, Copilot users vs non-users over two three-month windows | PR cycle time, PR throughput, bug rate | No significant change in cycle time or throughput; 41% more bugs in PRs by Copilot users |
| GitClear | 2024 | Repository analysis, ~153 million changed lines, 2020-2023 | Code churn (lines reverted or rewritten within two weeks), moved-vs-added ratio | Churn 3.1% in 2020 projected to ~7% in 2024; copy-pasted code rising, refactoring falling |
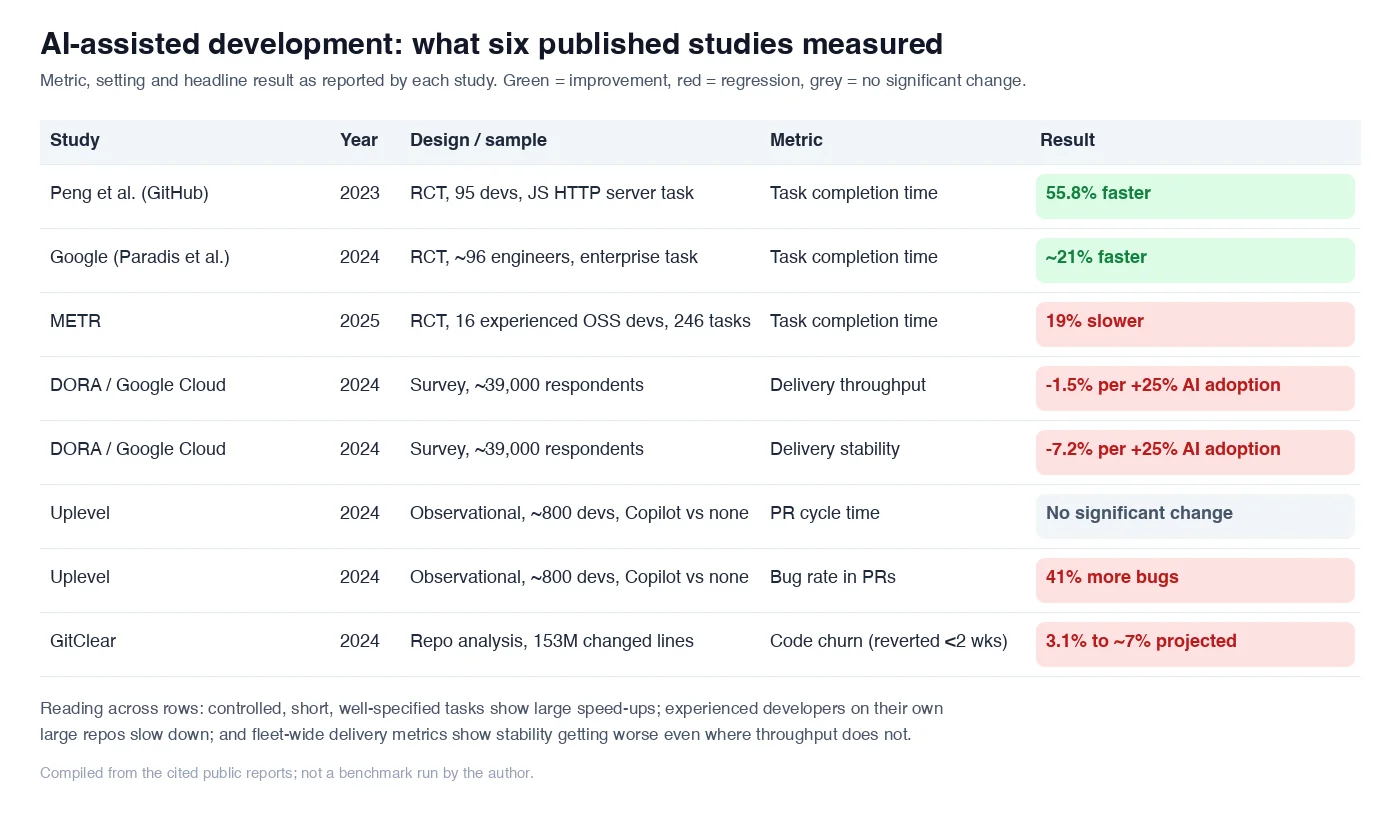
Sources, in the same order: Peng et al., The Impact of AI on Developer Productivity: Evidence from GitHub Copilot (arXiv 2302.06590); Paradis et al., How much does AI impact development speed? An enterprise-based randomized controlled trial (arXiv 2410.12944); METR, Measuring the Impact of Early-2025 AI on Experienced Open-Source Developer Productivity (July 2025); DORA, Accelerate State of DevOps Report 2024; Uplevel Data Labs, Can GenAI Actually Improve Developer Productivity? (September 2024); GitClear, Coding on Copilot: 2023 Data Suggests Downward Pressure on Code Quality (January 2024). The percentages above are quoted from those reports; I have not re-derived them.
Why the lab and the field disagree
The two RCTs that found big speed-ups share three properties: the task was chosen by the researchers, it was small enough to finish in a sitting, and the developer had no prior context in the codebase. That is exactly the regime where autocomplete and chat shine - the model’s knowledge of the language and the framework is worth more than the developer’s knowledge of the repo, because the developer has none.
METR flipped all three. Maintainers worked on their own issues, in repositories averaging a million-plus lines they had spent years in, on tasks taking a couple of hours. The 19% slowdown came mostly from time spent prompting, waiting and then reviewing or discarding suggestions that did not fit the repo’s conventions. The uncomfortable detail is the perception gap: the same developers estimated they had been 20% faster. If you are tracking AI adoption with a developer satisfaction survey, you are measuring that perception gap, not throughput.
DORA and Uplevel are the field view. Neither can prove causation - teams that adopt AI fastest may differ in other ways - but both are large, and both find the thing the RCTs cannot see: individual task speed does not become team delivery speed. If a developer finishes a change in 40 minutes instead of 60 but the PR still waits 19 hours for a reviewer, cycle time barely moves. That matches what we measured in the human-vs-agent review post: the arm that moved turnaround from 19.6 to 7.3 hours did it by changing the review step, not the writing step.
Stability is the number nobody advertises
Three of the six studies looked at quality rather than speed, and all three found it getting worse:
- DORA’s -7.2% stability per 25% AI adoption is a change-failure-rate and recovery-time composite. The report’s own reading is that larger, faster-arriving batches of change break more often.
- Uplevel’s 41% more bugs counted defects filed against PRs by Copilot users. Cycle time did not improve for the same PRs, so this is not a speed-for-quality trade; it is quality lost for nothing.
- GitClear’s rising churn is the slowest signal and the most structural: more added lines, fewer moved lines, more code rewritten within two weeks. Churn is a leading indicator for the incident rate DORA measures one or two quarters later.
This is consistent with the mechanism we saw directly in the mutation testing post: LLM output optimises for looking finished. Line coverage up, assertions weak; PR merged quickly, reverted a week later. None of the quality findings contradict the speed findings - they are the bill for them.
What to measure before believing any vendor number
If the published evidence is this split, your own organisation’s result will depend on which regime you are in. Measure these four before and after rollout, on the same repositories, for at least one quarter:
- PR cycle time, not task time. Open-to-merge, median and p90. This is the metric Uplevel found unchanged and the one your business actually feels. Task time self-reports will tell you about the METR perception gap and nothing else.
- Change failure rate and time to restore, per DORA’s definitions. If stability drops 5-7% while throughput is flat, you have reproduced the 2024 DORA finding and the rollout is net negative until review and testing catch up.
- Two-week churn on AI-touched files versus others. GitClear’s method is reproducible from
git logalone; a doubling of churn on AI-heavy paths is the earliest warning you will get. - Reviewer minutes per PR. This is the number that moved in our own data and the one none of the six public studies tracked. If AI makes writing cheaper and review no cheaper, the bottleneck has moved and cycle time will not follow.
Run those as a per-repo dashboard, the way the code-review agent metrics post does for a single bot, and decide per team each sprint. The published evidence does not say AI-assisted development is good or bad for the SDLC; it says the outcome is a property of your review and test loop, and that developers cannot feel the difference. Only the dashboard can.
Related
- AI SDLC: Human vs Agent PR Review - Measuring Test Coverage Quality With Defect Escape Rate and Mutation Score
- AI SDLC: How to Measure an AI Code-Review Agent Before You Trust It
- LLM-Generated Unit Tests in .NET: Why Coverage Lies and How Mutation Testing Keeps Them Honest
- AI SDLC: Where AI Actually Helps a .NET Team, Phase by Phase