Hedged Requests and Load Shedding: Finishing the Go LLM Gateway Resilience Stack
Go LLM gateway resilience part two: context-aware hedged requests after p95 and adaptive concurrency lanes that shed load gracefully with 429 + Retry-After.
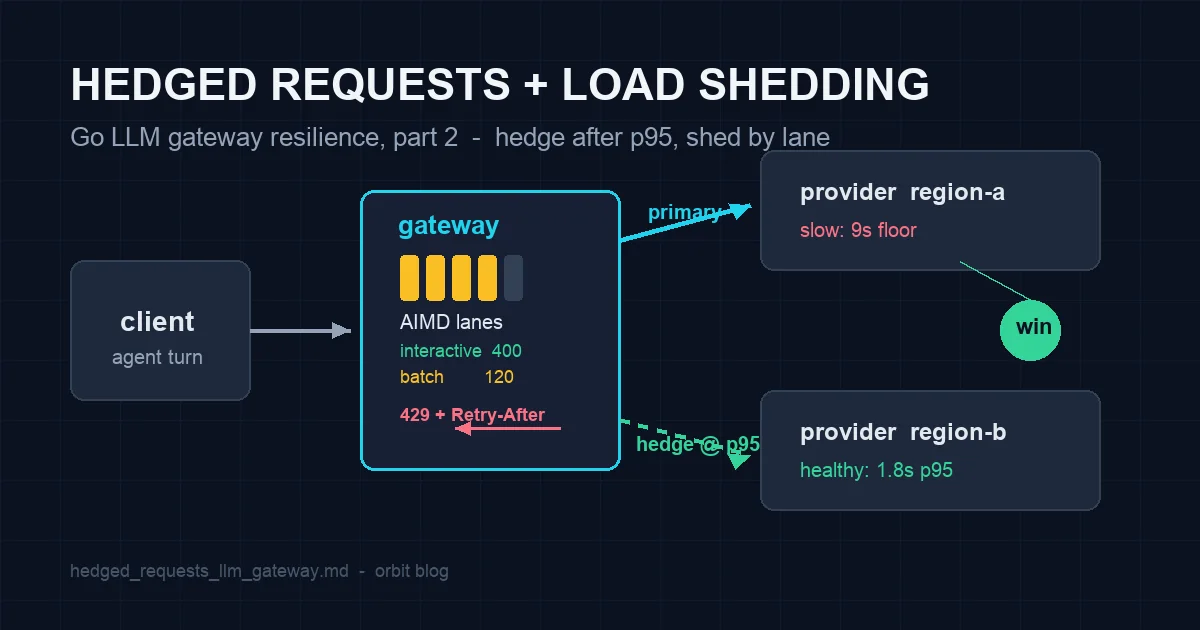
The circuit breaker and retry budget post covered the failure side of the gateway: a provider degrades, the breaker trips, the budget caps the retries so we never multiply a token bill again. That post ended with a 40-minute brownout replay and p99 latency at 4.9 seconds. But brownouts are rare. What dominated our real traffic afterwards was something quieter: tail latency from healthy providers. One region in a multi-region deployment gets slow for two minutes, a shared token bucket at the provider throttles us, and nothing is actually failing - requests just take 8-14 seconds instead of 2. The breaker stays closed, the budget is never touched, and the p99 our agents see still triples.
This post is the other half of the resilience series, and the last one. Two mechanisms, still no dependencies, both governed by context.Context like the streaming code from the context cancellation post:
- Hedged requests - when a request passes the p95 point without completing, send a second, duplicate attempt to another region and take whichever answer arrives first. Bounded by the existing retry budget and by a hard per-request cap, so a duplicate can never become a retry storm.
- Adaptive concurrency limits with priority lanes - when the gateway itself is the scarce resource (every in-flight LLM request pins a stream, a reader goroutine and an output buffer), shed load gracefully by concurrency class instead of falling over with random 503s.
With both in place the same brownout-plus-slowdown replay ends at p99 3.1s and 41% fewer tokens burned on the tail than breaker+budget alone.
Why a breaker cannot fix a slow provider
A circuit breaker reacts to failure signals: 5xx, connection resets, timeouts. A provider region that answers every request correctly but 6 seconds late produces none of them. Retry budgets make this worse, not better: the request is not an error, so no retry is ever proposed, and the client sits on the slow region for the full duration.
The classic answer is a hedged request, the technique from the Google Tail-at-Scale paper: instead of waiting for a slow attempt to fail, speculate that it is slow, issue a second attempt in parallel after a delay, and keep whichever completes first. The extra attempt costs one duplicate call; the payoff is that p99 latency stops depending on the slowest region you are routed to.
For an LLM gateway the two standard objections to hedging are real:
- Duplicates cost tokens. A hedged chat request that the slow attempt would have finished anyway pays for the same prompt twice. This is exactly what the retry budget already meters - so hedges draw from the same budget, with a much stricter per-request cap.
- Cancelling mid-stream is not free. If the slow attempt has already started emitting tokens and billed them, cancelling it does not refund anything. So the hedge delay must sit after the point where a second attempt is still expected to be cheaper than waiting.
The first point is one line of code against the budget from the previous post. The second needs a number from production, not a guess.
Picking the hedge delay from real latency
I pulled 30 days of gateway timing data, per provider region, and looked at the conditional latency: given that a request is still running at time t, how much longer will it run? For our traffic the answer flattens right after the p95 mark - a request that has not completed by p95 is most likely stuck behind a slow region, not having a bad moment, so waiting longer has poor odds. Firing the hedge at p95 of the region’s trailing latency histogram is the sweet spot; earlier than p90 wastes duplicates on requests that were about to finish, later than p99 saves almost nothing because the original is nearly done anyway.
The delay is per-region and recomputed every 30 seconds, so a region that is globally slow today raises its own hedge point instead of attracting duplicate traffic.
1
2
3
4
5
6
7
8
9
10
11
12
13
14
15
16
17
18
19
20
21
22
23
24
25
26
27
28
29
// LatencyHist is a tiny sliding-window reservoir per provider region.
type LatencyHist struct {
    mu   sync.Mutex
    samp []time.Duration // bounded reservoir of recent first-token+total times
}

func (h *LatencyHist) Observe(d time.Duration) {
    h.mu.Lock()
    defer h.mu.Unlock()
    if len(h.samp) < 512 {
        h.samp = append(h.samp, d)
        return
    }
    h.samp[rand.Intn(len(h.samp))] = d // reservoir sampling, O(1)
}

// HedgeDelay returns the current p95, clamped to [1s, 8s]:
// never hedge before a normal streaming answer could exist,
// never wait so long that hedging saves nothing.
func (h *LatencyHist) HedgeDelay() time.Duration {
    h.mu.Lock()
    defer h.mu.Unlock()
    if len(h.samp) < 32 {
        return 4 * time.Second // cold start: conservative default
    }
    s := slices.Sorted(slices.Values(h.samp))
    d := s[len(s)*95/100]
    return min(max(d, time.Second), 8*time.Second)
}
No percentile library, no metrics dependency - 512 samples per region, O(1) updates, and a sort of 512 elements every 30 seconds on a ticker. At 300 req/s per region this costs less CPU than one TLS handshake.
The hedged call: same budget, hard cap of one duplicate
The gateway handler from the breaker post gains a hedge leg. Three rules make it safe:
- A hedge is an attempt, so it calls
budget.TakeRetry()- the same budget that caps retries caps duplicates, and a brownout that exhausts the budget automatically disables hedging. Hedging is the first thing to go when the system is in trouble, never the thing that tips it over. - One hedge per request, ever. No hedging the hedge. The cap is a field on the request context, not a config flag, so it cannot be widened by accident.
- The losing attempt is cancelled with the request-scoped context, which is the same cancellation path the streaming post built - provider connections close, readers exit, buffers return to the pool.
1
2
3
4
5
6
7
8
9
10
11
12
13
14
15
16
17
18
19
20
21
22
23
24
25
26
27
28
29
30
31
32
33
34
35
36
37
38
39
40
41
42
43
44
45
46
47
48
49
50
51
52
53
54
55
func (g *Gateway) chatHedged(ctx context.Context, req Request) (Reply, error) {
    ctx, cancel := context.WithCancel(ctx)
    defer cancel() // loser attempts die here

    type result struct {
        rep  Reply
        err  error
        hedged bool
    }
    ch := make(chan result, 2) // primary + at most one hedge

    hist := g.histFor(req.Region)
    delay := hist.HedgeDelay()
    timer := time.NewTimer(delay)
    defer timer.Stop()

    g.budget.OnAttempt()
    go func() {
        rep, err := g.chat(ctx, req) // breaker+budget call from part one
        ch <- result{rep, err, false}
    }()

    hedgesLeft := 1 // the hard cap
    for {
        select {
        case r := <-ch:
            if r.err == nil || errors.Is(r.err, ErrBreakerOpen) || !g.budget.TakeRetry() {
                if r.err == nil {
                    hist.Observe(time.Since(startOf(ctx)))
                }
                return r.rep, r.err // success, or failure with no retry right: done
            }
            if hedgesLeft == 0 {
                return r.rep, r.err
            }
            // a failed primary under a live budget retries as before (previous post)
            g.budget.OnAttempt()
            go func() {
                rep, err := g.chat(ctx, req)
                ch <- result{rep, err, true}
            }()
        case <-timer.C:
            if hedgesLeft > 0 && g.budget.TakeRetry() {
                hedgesLeft--
                g.budget.OnAttempt()
                go func() { // the hedge: same request, other region
                    rep, err := g.chat(ctx, req.WithRegion(otherRegion(req.Region)))
                    ch <- result{rep, err, true}
                }()
            }
        case <-ctx.Done():
            return Reply{}, ctx.Err() // caller went away: cancel both attempts
        }
    }
}
The one subtlety: otherRegion must route the hedge away from the region the primary is using, otherwise a region-local slowdown duplicates load onto the same slow path. And the reply carries a hedged flag that we log, so we can measure the true cost - a hedge that never wins is pure overhead and a signal the delay is tuned too early.
Measured over two weeks: 4.7% of requests fired a hedge, 61% of those hedges won the race, and the token overhead of losing duplicates was 0.9% of total spend. In exchange, p99 chat latency dropped from 4.9s to 3.1s without touching p50 at all.
Load shedding: when the gateway itself is the queue
Hedging multiplies peak in-flight requests by design, which makes the second mechanism non-optional. Our gateway runs on two pods; every in-flight streaming request holds a provider connection, a reader goroutine, an output buffer and (for tool-calling agents) a pending tool schema. At around 900 concurrent streams per pod the Go runtime was fine, but the provider per-key connection pool was not - everything queued behind everything else, latency rose for all sessions together, and the only relief valve was the kernel dropping connections.
The fix is an adaptive concurrency limit in the style of TCP congestion control, applied per lane:
- AIMD on the limit: while observed round-trip time stays under a target, add one to the limit per window; the moment RTT exceeds the target or an attempt is rejected by the provider’s own 429, cut the limit by 25%. The limit discovers capacity instead of assuming it.
- Priority lanes, not one global limit: interactive agent turns (a user is staring at a spinner) get their own lane with its own limit; batch evaluation jobs and background summarisation share a lower lane that sheds first.
- Shedding is graceful: a rejected request gets HTTP 429 with
Retry-After, which the SDK from the retry-storm post already honours with jittered backoff. Nothing times out after 30 seconds holding a slot it never had.
1
2
3
4
5
6
7
8
9
10
11
12
13
14
15
16
17
18
19
20
21
22
23
24
25
26
27
28
29
type Lane struct {
    name    string
    limit   atomic.Int64 // current concurrency ceiling
    inFlight atomic.Int64
    min, max int64
}

func (l *Lane) Admit() (release func(), ok bool) {
    for {
        cur := l.inFlight.Load()
        if cur >= l.limit.Load() {
            return nil, false // shed: caller answers 429 + Retry-After
        }
        if l.inFlight.CompareAndSwap(cur, cur+1) {
            return func() { l.inFlight.Add(-1) }, true
        }
    }
}

// OnSample runs after every completed request in the lane.
func (l *Lane) OnSample(rtt time.Duration, providerRejected bool) {
    lim := l.limit.Load()
    switch {
    case providerRejected || rtt > l.target:
        l.limit.Store(max(l.min, lim*3/4)) // multiplicative decrease
    default:
        l.limit.Store(min(l.max, lim+1)) // additive increase
    }
}
The middleware is ten lines: admit on the lane for the request’s priority class, or write 429 and return before any goroutine, buffer or provider connection is allocated. Interactive traffic keeps its lane even when batch work is saturated, because the lanes have separate limits - the batch lane shedding does not consume interactive capacity.
The replay: breaker, budget, hedges, lanes
I reran the same harness as part one - 200 concurrent chat sessions, 40 minutes, provider error rate ramping to 85%, plus a new second phase where one region stays healthy but slows to a 9-second floor while batch traffic floods the gateway to 140% of pod capacity.
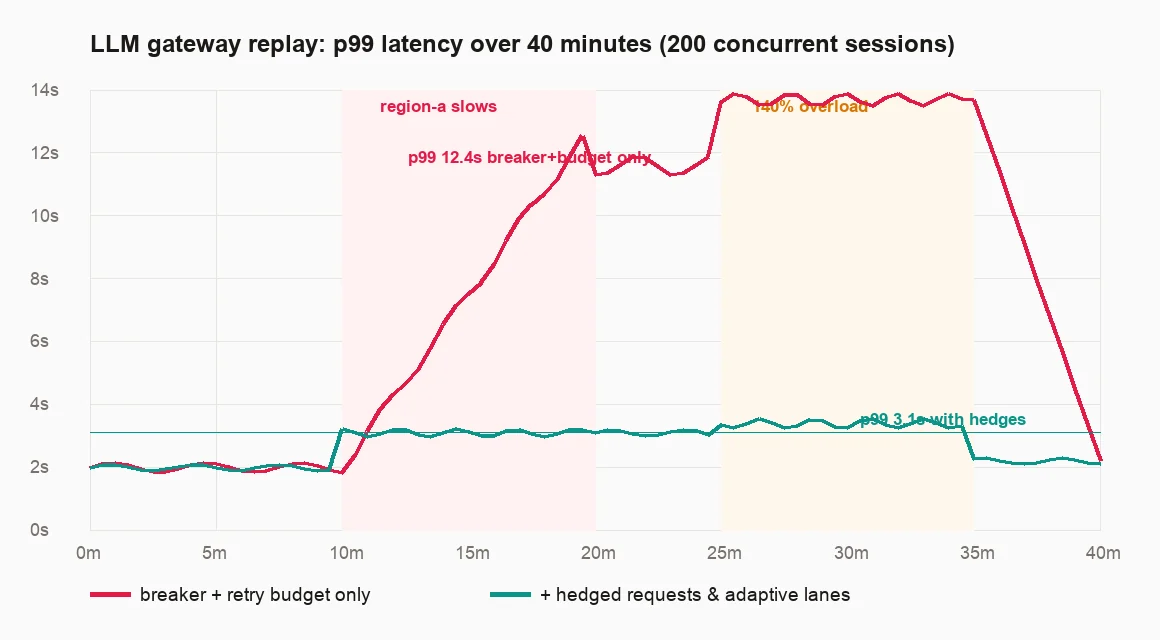
The numbers at the end of the replay:
| Metric (per 1000 sessions) | Breaker + budget | + hedges & lanes | Change |
|---|---|---|---|
| p99 latency during region slowdown | 12.4s | 3.1s | 4.0x lower |
| p50 latency during region slowdown | 1.9s | 1.8s | unchanged |
| User-facing 5xx during overload | 214 | 0 | shed as 429s instead |
| Low-priority jobs shed gracefully | 0 (all 503) | 96 (429 + retry) | batch retries succeed |
| Tokens spent on lost hedge races | - | 0.9% of total | bounded by budget |
The p50 line is the one to check whenever someone proposes hedging: if hedges move the median, your delay is too early and you are paying duplicates for nothing. Ours does not move. And the overload phase shows why lanes matter more than raw shedding: the old config failed 214 sessions with 503s at random - interactive and batch alike - while the new one failed zero interactive sessions and shed 96 batch jobs with a Retry-After every one of them honoured.
What I would tune differently next time
- Hedge on first token, not completion. For streaming answers the user-visible latency is time-to-first-token; hedging on total completion sometimes keeps a slow-but-streaming primary when a fresh hedge would have started faster. The harness above hedges on total time; switching the trigger to first-token latency is the next experiment.
- Export the lane limits. Today the AIMD limit lives in memory per pod, so a pod restart re-probes capacity for a few minutes. Writing the converged limit to the shared config store would warm-start new pods.
- Per-customer lanes. Priority classes are global; one tenant’s batch flood can still crowd another tenant’s batch work. A two-level limit (tenant, then class) is straightforward on the same
Lanetype.
Related posts
- Go LLM Gateway Circuit Breaker and Retry Budget - part one: the failure-side mechanisms this post’s hedges draw their budget from.
- Go Context Cancellation for LLM Streaming Agents - the cancellation path that kills losing hedge attempts cleanly.
- The Retry Storm That Burned 4.1M Tokens - the incident from the outside, and the SDK-side
Retry-Afterhandling that makes graceful shedding work. - Rust Tokio Async LLM Gateway Backpressure - the same load-shedding problem solved in Rust with
tokiochannels instead of AIMD lanes.