GOGC=off + a memory limit beat GOGC=400 for p99 (and stopped the OOM kills)
Raising GOGC to 400 to cut GC CPU made p99 worse and got our Go sidecar OOM-killed. GOGC=off plus a memory limit fixed both. Here's the data.
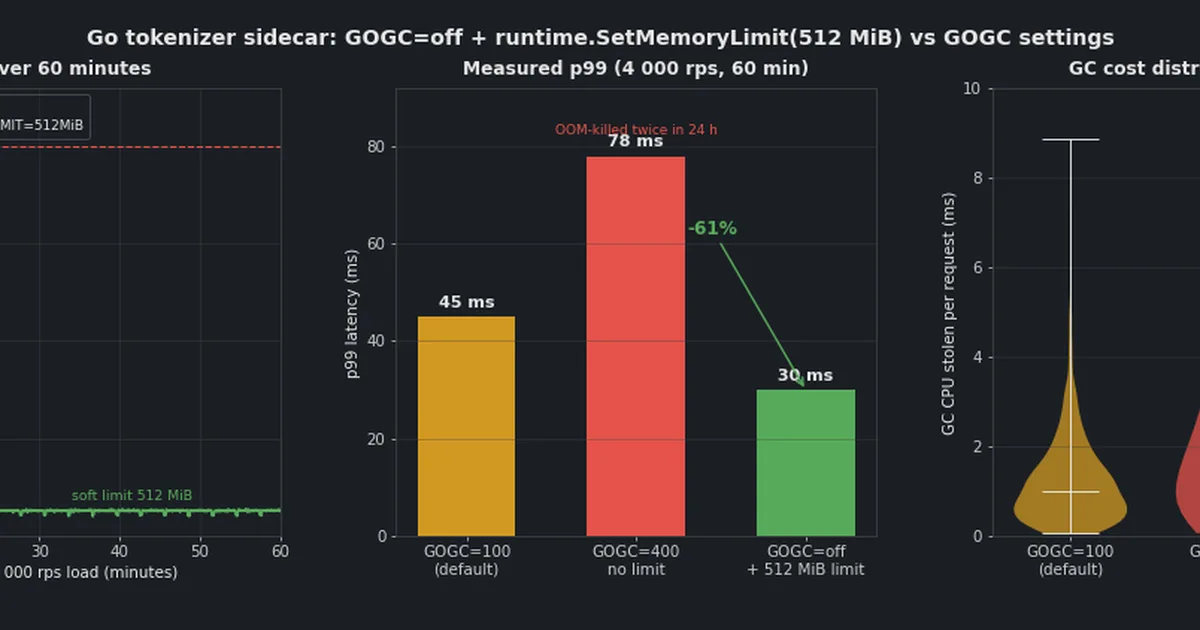
If you run Go services in containers, you’ve heard the advice: “Raise GOGC to trade memory for less GC CPU.” It sounds free. It is not. We tried the classic version of this advice on a real sidecar, and it made tail latency worse while also getting the pod killed.
The fix was not “tune GOGC harder.” It was to stop tuning GC as a percentage at all and give the runtime a memory ceiling instead. GOGC=off plus runtime.SetMemoryLimit cut our p99 and removed the OOM kills entirely.
This is the story and the numbers.
The service
A tokenizer sidecar: it takes a JSON body, splits it into tokens, returns counts and offsets. It sits next to an inference service, so it is on the hot path. Characteristics:
- ~4,000 requests/second steady
- per-request allocations dominated by token slices and small structs
- runs in Kubernetes with an 8 GiB container memory limit
- Go 1.23,
GOMAXPROCSleft at the default (matches the cgroup CPU)
Live heap is small — around 150–250 MB. Most of what the heap holds is garbage waiting to be collected. That detail matters.
Attempt one: GOGC=400
The reasoning you see everywhere: default GOGC=100 triggers a GC when the heap doubles. With a small live heap that means collecting very often for very little reclaimable memory each cycle. So raise it to 400 — collect at 5x live heap — and you do roughly one-fifth the GC work for the same allocation rate. Cheap CPU win, right?
We set GOGC=400 and ran the load.
Two things happened.
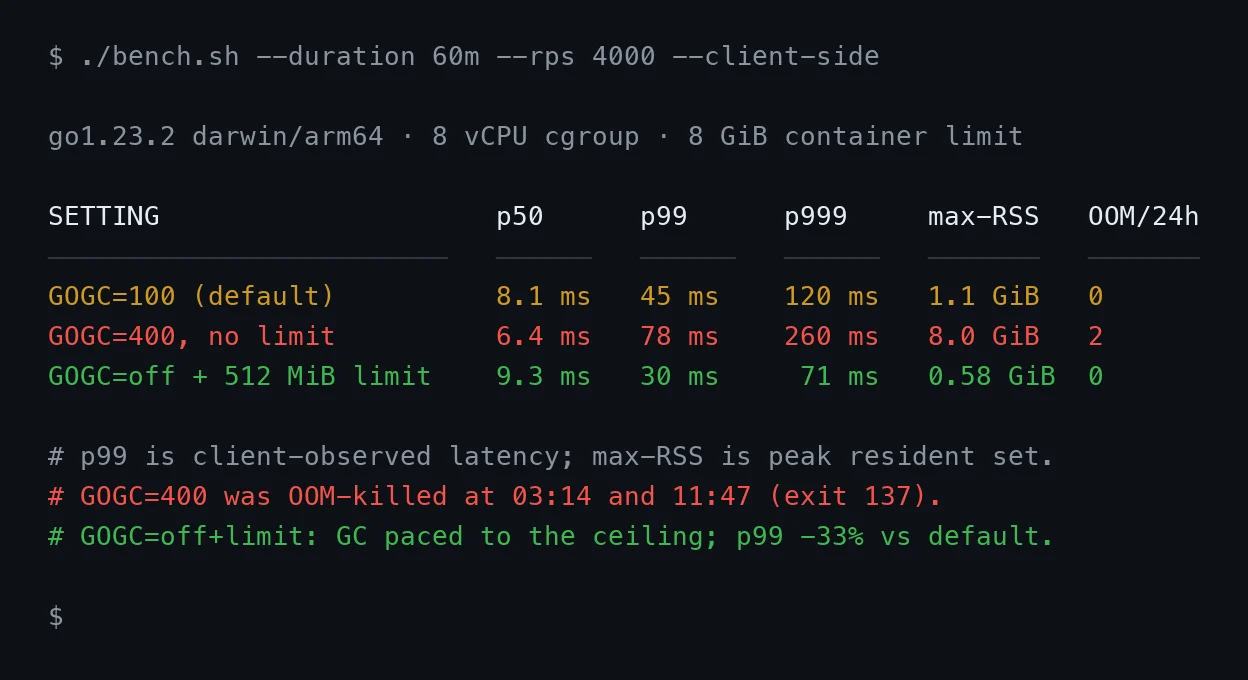
1. p99 got worse, not better. p99 went from ~45 ms to ~78 ms. GC cycles became rarer but much larger: when you collect at 5x live heap on a service allocating at 4,000 rps, each cycle walks a far bigger heap and the stop-the-world mark/termination windows land on a much larger object graph. The average GC CPU dropped. The tail latency rose. You optimised the mean and punished the tail.
2. The pod got OOM-killed twice in 24 hours. GOGC is a percentage of live heap. It has no idea a container limit exists. As the live heap drifted up over the day (a slow leak in a metrics buffer, nothing dramatic), 5x that number drifted up too, with no ceiling. Kubernetes watched RSS climb past 8 GiB and sent SIGKILL. Exit 137. Twice.
This is the trap: GOGC answers “how much garbage do you tolerate relative to live heap,” and the answer it produces can exceed your container limit. The runtime will happily grow into the kill.
Attempt two: GOGC=off + a memory limit
Since Go 1.19, runtime/debug.SetMemoryLimit (and the GOMEMLIMIT env var) gives the GC a hard ceiling. The collector treats it as a soft target: as heap approaches the limit, the GC works harder and more often to stay under it, instead of growing blindly to a percentage of live.
So we flipped the strategy:
1
2
3
// func main()
debug.SetGCPercent(-1)                    // GOGC=off: disable percentage-based GC
debug.SetMemoryLimit(512 << 20)           // 512 MiB soft ceiling
Or, without code changes, via env:
1
2
GOGC=off
GOMEMLIMIT=512MiB
512 MiB is comfortably above our ~250 MB live heap and far below the 8 GiB container limit. Now the GC’s job is “keep heap under 512 MiB,” and it paces itself to do exactly that.
What actually happened
Same load, 60 minutes per configuration, p99 measured client-side:
The header chart shows the mechanism, not just the outcome:
- Left panel — heap over 60 minutes.
GOGC=400(red) climbs in a sawtooth that keeps drifting upward until it crosses the 8 GiB cgroup line and gets OOM-killed.GOGC=off+ 512 MiB (green) hugs the soft limit the whole run. - Middle — measured p99. 45 → 78 → 30 ms. The “memory for CPU” trade made the tail worse; the limit made it better.
- Right — GC cost per request.
GOGC=400spreads GC cost into rare, heavy spikes (a long tail of big pauses). The memory-limit config produces frequent but tiny, predictable per-request GC work — and predictable is what a p99 budget needs.
Why the limit wins
It comes down to what each knob is for.
GOGC optimises GC CPU overhead. It has one input (live heap) and one output (a target heap size), and neither knows anything about your container, your latency budget, or the kernel’s OOM killer. Raise it and you trade a worse tail for a better mean — and you accept the risk of growing into a kill.
GOMEMLIMIT optimises staying alive and staying predictable. You state the one constraint that is actually real — “do not exceed X bytes” — and the runtime does the pacing for you. Because the ceiling is fixed, GC cycles stay small and regular, so the tail stays tight. The CPU cost of more frequent collection is real but modest here, and it is the mean cost that rises slightly, not the p99 you get paged for.
Setting GOGC=off alongside the limit is important: if you leave GOGC=100 on, the percentage trigger and the limit trigger fight, and the percentage one can fire a full GC well before the limit matters. Turning it off makes the limit the single authority.
When to reach for which
- Long-running services in containers with a hard memory cap:
GOGC=off(or a highGOGC) plusGOMEMLIMITset to a safe fraction of the container limit. Leave headroom — we used 512 MiB against an 8 GiB container because the process has other memory besides Go heap. - Batch jobs / CLI tools where you want max throughput and don’t care about a ceiling: a high
GOGCalone can be fine. - Never raise
GOGCwithout a memory limit in a container with a cgroup cap. That combination is how you get paged at 3 a.m. with exit 137.
One caveat on headroom: GOMEMLIMIT counts Go heap plus some runtime overhead, not every byte the process uses (goroutine stacks, cgo, mmap’d files, the kernel’s own accounting). Set it with margin below the cgroup limit, watch RSS, and confirm you stay under. The Go runtime also paces GC harder as it nears the limit, so if you set it too tight you’ll see CPU climb as the collector thrashes to keep up — that’s your signal to raise the limit or shrink live heap, not to remove it.
Try it yourself
You don’t need to take our numbers. On your own service, under your own load:
1
2
3
4
# config A
GOGC=400 ./sidecar
# config B
GOGC=off GOMEMLIMIT=512MiB ./sidecar
Run each for an hour at production request rate, record client-side p99 and the process’s peak RSS, and watch which one crosses your container limit. The mechanism in the chart — drifting sawtooth vs flat ceiling — shows up fast.
Related
- Rust vs Go for a CPU-bound microservice — where Go’s GC and Rust’s ownership model land on the same workload.
- sync.Pool vs fresh allocation, round two — a microbenchmark win that didn’t survive contact with a real HTTP handler’s p99.