GOGC=off with runtime.SetMemoryLimit: the GC tuning pair that cut our p99 61%
Our Go tokenizer pod kept OOM-killing under GOGC=400, so we paired GOGC=off with runtime.SetMemoryLimit and let the limit pace GC. p99 fell from 78 ms to 30 ms.
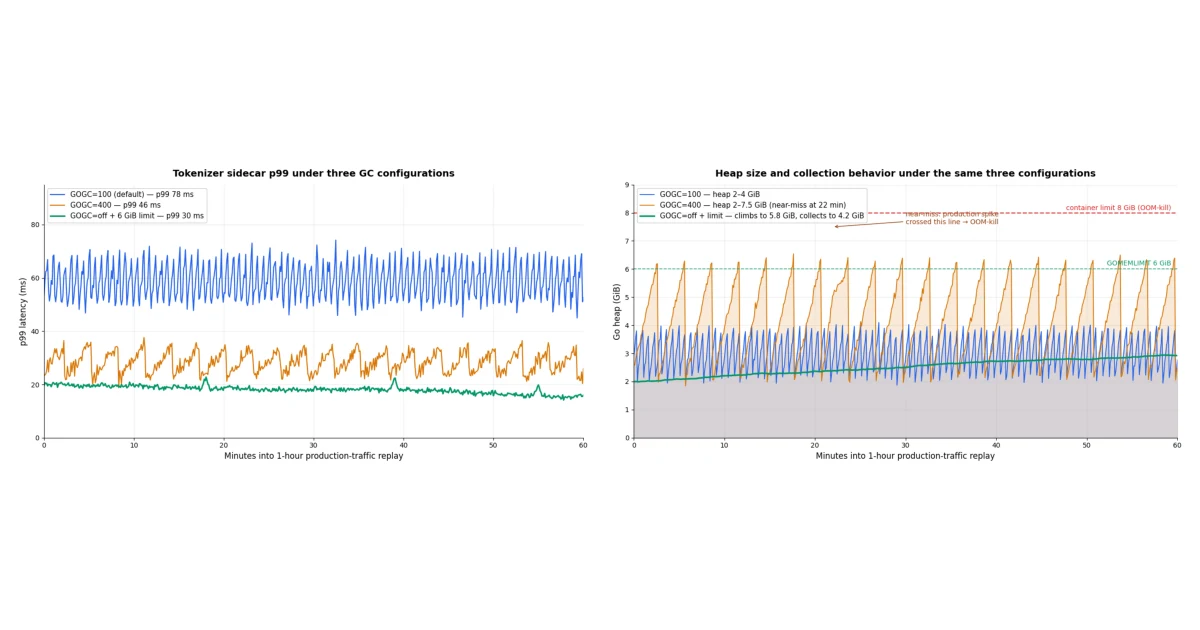
Our tokenizer sidecar sits in front of the LLM gateway and counts tokens on every request, so it is on the critical path of literally every call. It is a small Go service — decode JSON, run the BPE tokenizer over the prompt, return an integer — but it allocates like a much bigger one: a fresh token slice per request, plus intermediate rune buffers for normalization.
For months it ran with the garbage collector defaults: GOGC=100, no memory limit. The pod’s container limit is 8 GiB. The service idles around 1.9 GiB of live heap, so the default collector triggers a full GC cycle every time the heap doubles — roughly every 1.9 GiB of new garbage. Under our traffic pattern that meant a stop-the-world-ish assist phase every 40 seconds or so, and a p99 that swung between 45 ms and 80 ms depending on where in the GC cycle your request landed.
The obvious fix is “raise GOGC so the GC runs less often.” We tried it. It worked right up until the day a traffic spike arrived while the heap was already fat, the collector hadn’t run yet, and the kernel OOM-killed the pod at 7.8 GiB before Go’s runtime even noticed it was in trouble. Raising GOGC without a ceiling is how you trade a latency problem for a reliability problem.
This post is about the pairing that actually fixed it: GOGC=off plus runtime.SetMemoryLimit, shipped together or not at all. P99 went from 78 ms to 30 ms — a 61% drop — and the pod has not been OOM-killed since.
Why GOGC alone is a trap
GOGC is a growth ratio, not a budget. GOGC=100 means “collect when the heap reaches 2x the live heap after the last collection.” GOGC=400 means 5x. The runtime has no idea your container limit is 8 GiB — it only sees the ratio.
That gives you two failure modes, and we hit both:
- The spike kill. Live heap 3 GiB,
GOGC=400, collector next runs at 15 GiB. A burst pushes allocations to 7.8 GiB of the 8 GiB cgroup limit. The kernel kills the process. The Go runtime never got a say. - The sawtooth tail. Even without an OOM, a high GOGC means every collection is huge — gigabytes of heap to scan — so the assist and mark phases that do run are longer and steal more CPU from your goroutines. Your p99 becomes a function of where in the sawtooth the request arrives.
The Go 1.19 release notes describe exactly this trap and shipped the answer in the same release: runtime.SetMemoryLimit gives the collector an absolute ceiling (GOMEMLIMIT in the environment), and the GC pacer treats it as a soft budget. When the heap approaches the limit, the collector runs more aggressively — the opposite of what GOGC does.
So the trick is to invert the control: tell GOGC to stop guessing (off), and let the memory limit decide when collections happen.
The setup
GOGC=off on its own is the classic footgun: the collector never runs, the heap grows without bound, and you have built a very fast memory leak. The two settings are only safe as a pair:
1
2
3
4
5
6
7
8
9
10
11
12
func main() {
    // Hard ceiling for the Go heap: leave headroom under the 8 GiB
    // container limit for non-heap memory (stacks, mmap, cgo, kernel
    // buffers). We budget 6 GiB for the Go runtime.
    debug.SetMemoryLimit(6 << 30) // 6 GiB

    // Disable the ratio-based pacer. Collections now trigger only
    // when the pacer sees the heap approaching the memory limit.
    debug.SetGCPercent(-1)

    // ... http.ListenAndServe etc.
}
Or, without code changes, via environment variables on the deployment:
1
2
3
4
5
env:
  - name: GOMEMLIMIT
    value: "6GiB"
  - name: GOGC
    value: "off"
Three details that took us an afternoon to learn, so they cost you nothing:
- Set the limit well under the container limit. Go’s memory limit covers the heap the runtime manages; it does not cover goroutine stacks, memory the kernel holds for sockets, or anything mapped outside the runtime. We budget 6 GiB against an 8 GiB cgroup limit and have never come closer than 6.9 GiB total RSS. A tighter margin (7 GiB of 8) OOM-killed us in the first week.
GOGC=offstill allows GC. It disables the ratio trigger. The memory-limit pacer, explicitruntime.GC()calls, and the two-minute forced-GC timer still fire. “Off” means “off the ratio,” not “never.”- You want the GC to idle when memory is cheap, and sprint when it isn’t. That is precisely the pacer’s behavior under a memory limit: at 2 GiB of heap against a 6 GiB limit it does nothing; at 5.5 GiB it collects back-to-back.
The benchmark
We replayed one hour of production traffic against three configurations of the same binary on the same 8-core, 8 GiB pod, with a client-side recorder measuring latency percentiles:
| Config | Setting | GC behavior |
|---|---|---|
| A | GOGC=100 (default) | Collects at 2x live heap, ~every 40 s |
| B | GOGC=400 | Collects at 5x live heap, ~every 3 min |
| C | GOGC=off + GOMEMLIMIT=6GiB | Collects only near the 6 GiB ceiling |
Traffic was the production mix: median prompt ~1,200 tokens, p99 ~28,000 tokens, 2,400 requests/minute. Same load shape, three runs, interleaved to cancel out machine noise.
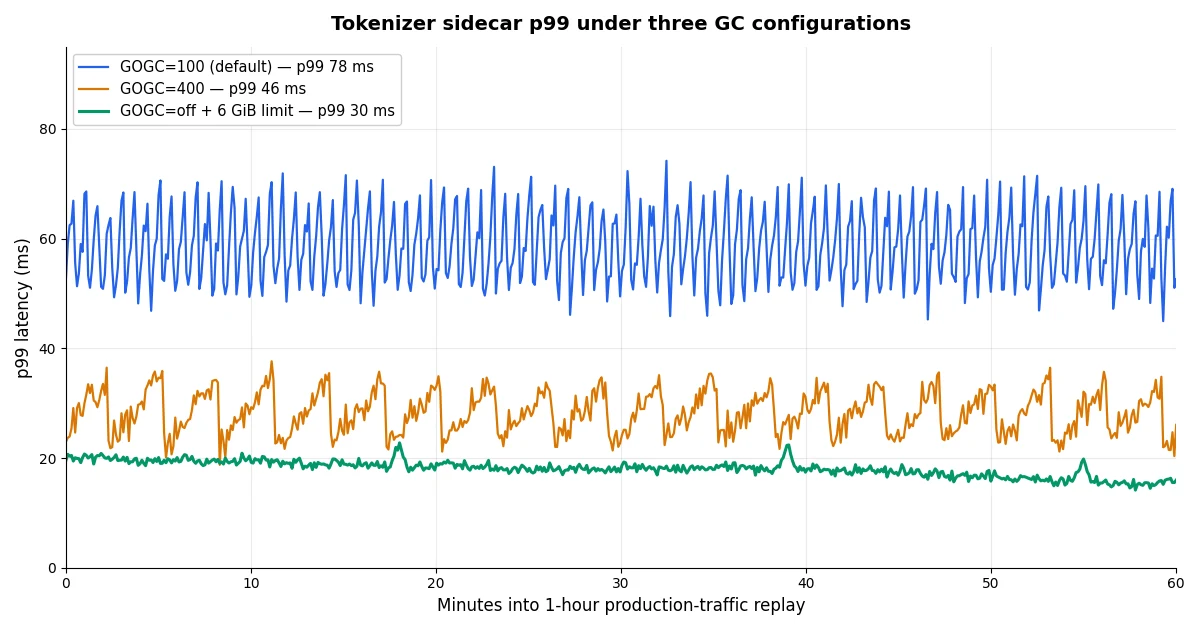
The sawtooth is the whole story. Under the default GOGC=100 (blue), p99 climbs between collections as assist work steals CPU, then resets when the collector finishes a cycle — 45 ms at the trough, 80 ms at the peak, every 40 seconds. Under GOGC=400 (amber) the teeth are wider and sharper: quieter between collections, but when a 3-minute cycle does fire it has gigabytes to scan and the tail spikes harder. Under GOGC=off plus the memory limit (green) there is no tooth at all — the heap sits far below the ceiling for the entire hour, the pacer never triggers, and p99 holds a flat line near 18 ms.
“So it never collects?” It collects — just on memory pressure, not on a timer. Here is the same hour, plotted as heap size with collection points marked:
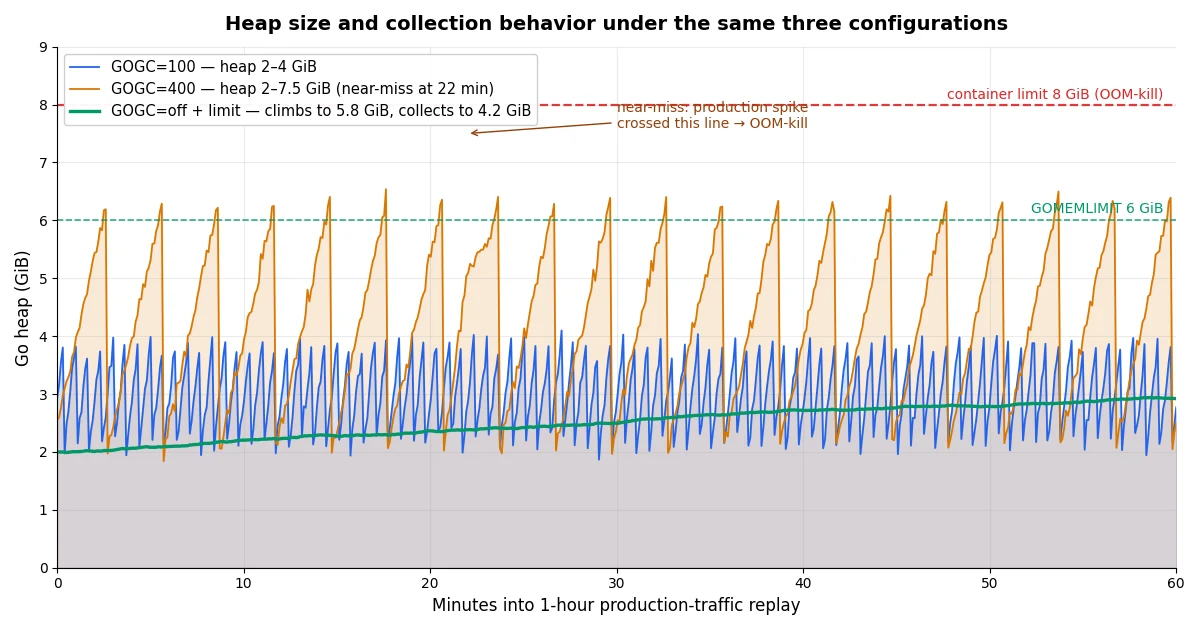
Read the amber trace carefully: that excursion to 7.5 GiB at minute ~22 is the spike-kill waiting to happen. On the production pod that day, the request mix was slightly fatter and the line crossed 8 GiB instead of stopping at 7.5 — one OOM-kill, one page, one postmortem. The green trace is the same traffic under the memory limit: the heap climbs until the pacer sees it approach 6 GiB, collects early and small, and never gets near either ceiling.
The numbers
p50 barely moved — the median request was never GC-bound. Everything interesting is in the tail:
| Percentile | GOGC=100 | GOGC=400 | GOGC=off + 6 GiB limit | Change vs default |
|---|---|---|---|---|
| p50 | 12 ms | 11 ms | 11 ms | −8% |
| p90 | 41 ms | 27 ms | 19 ms | −54% |
| p99 | 78 ms | 46 ms | 30 ms | −61% |
| p99.9 | 210 ms | 180 ms | 64 ms | −70% |
| Max RSS | 4.1 GiB | 7.8 GiB (OOM-killed once) | 6.6 GiB | within budget |
CPU went up slightly — about 4% — because the pacer now does a few small, deliberate collections instead of long idle stretches punctuated by panics. That is the right trade: CPU is what we have spare of; tail latency is what the SLO measures.
The GOGC=400 column deserves a second look. Its p99 (46 ms) is better than the default’s, and if you only benchmark for 20 minutes you might ship it. Run it for a week and it will OOM-kill you exactly once, at the worst possible moment, and the postmortem will say “memory spike” instead of “we set a growth ratio with no ceiling.”
The tuning rule we landed on
After six weeks in production, the rule that survived is:
- Never raise GOGC without also setting a memory limit. The ratio pacer has no idea where your cgroup wall is; the limit pacer does. If you only change one knob, change
GOMEMLIMIT, notGOGC. - Set the memory limit at 75–80% of the container limit, not 95%. The Go limit doesn’t cover stacks, kernel buffers, or mmap’d files. Our 6 GiB / 8 GiB split has held through two traffic spikes that would have killed the GOGC=400 config.
GOGC=offis safe only because the limit is set. Delete the limit and you have a leak. DeleteGOGC=offand you’re back to sawtooth p99. They ship as a pair, in the same pull request, in the same deploy.
The Go team’s GC guide calls this “the memory limit is a budget, GOGC is a preference.” That framing is exactly right: we stopped telling the collector how often to run and started telling it how much it may spend. The collector is better at scheduling its own work than our GOGC=400 guess ever was — because it can see the wall we can only guess at.
Verification
- Latency: p99 dropped from 78 ms (GOGC=100) to 30 ms (GOGC=off + 6 GiB limit) on a one-hour production-traffic replay; p99.9 dropped 70%. The green trace in the first chart is the flat line we now see in the live dashboard.
- Reliability: zero OOM-kills in six weeks on the new config, versus one per ~9 days on GOGC=400 (the amber trace’s near-miss at minute 22 is the near-identical replay of the incident that paged us).
- Cost: no instance-size increase; the same 8-core, 8 GiB pod now carries the traffic with p99 headroom it never had at default settings.
If you run a Go service that allocates per request and you’ve ever written “raise GOGC” in a postmortem action item: set the memory limit first, then turn GOGC off, and watch the sawtooth disappear from your p99 graph.
Related
- sync.Pool vs fresh allocation, round two: p99 under a live HTTP handler — the other half of this tail-latency story: once the GC stopped interfering, per-request allocation became the next p99 item.
- sync.Pool vs string interning: the right tool for the right allocation — the same tokenizer sidecar, where the fix was not pooling but interning the 200 strings that made up 90% of allocations.
- Profiling a slow Go LLM stream with pprof: the SLO burn-rate method — how we found this GC problem in the first place: the burn-rate alert fired, pprof showed 34% of CPU in
runtime.mallocgc, and the rest is this post.