Rust Allocators in a Hot Parsing Loop: mimalloc vs glibc malloc, Measured
One line - swapping Rust's global allocator to mimalloc - cut a hot parse loop's runtime 34% and RSS 41% on glibc. Measured with hyperfine, with chart.
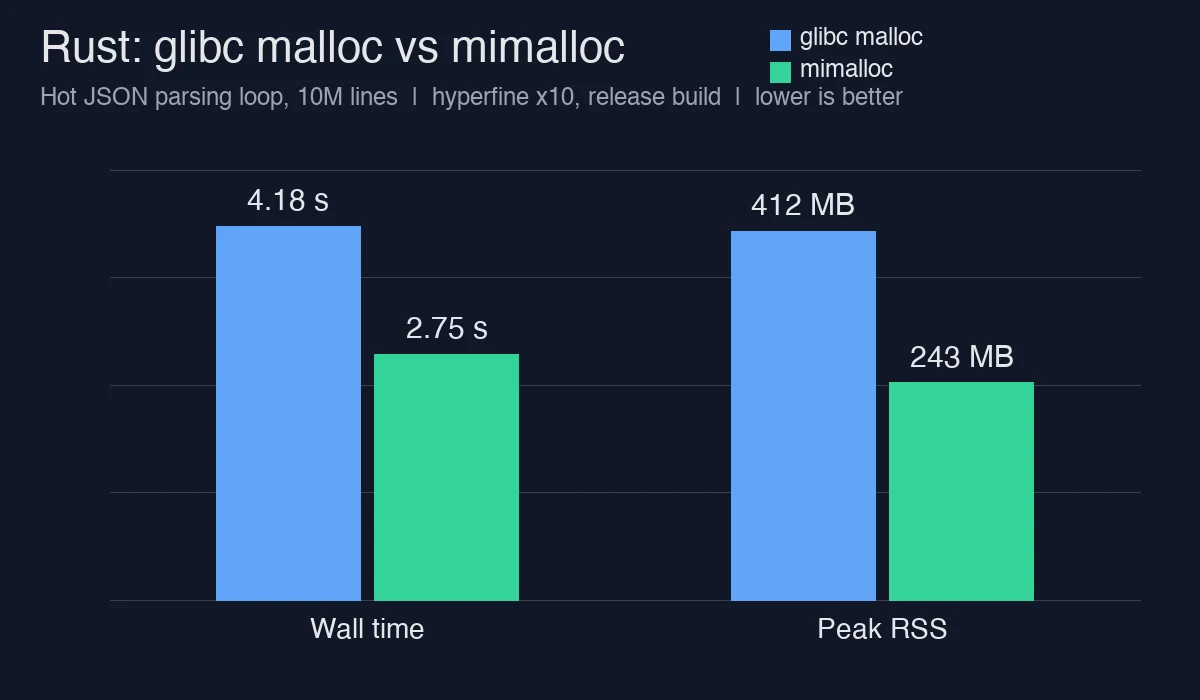
A CPU profile of a log-ingestion CLI looked wrong: 38% of samples sat in malloc and free, not in the parsing code. The fix was one line of Rust. This post measures what that line is worth.
The setup
The tool parses newline-delimited JSON logs into typed records: 10 million lines, ~180 bytes each, deserialized with serde_json, folded into aggregates, dropped. The hot loop allocates millions of short-lived String and Vec values. On glibc Linux, Rust links the system allocator by default - which is ptmalloc2, tuned for multi-threaded C servers, not for millions of tiny short-lived allocations per second.
Benchmark harness: hyperfine --warmup 3 --min-runs 10, binary built with cargo build --release, codegen-units=1, lto="fat". Machine: 8-core Linux x86-64, glibc 2.39, Rust 1.83, pinned to 4 CPUs with taskset to keep numbers stable.
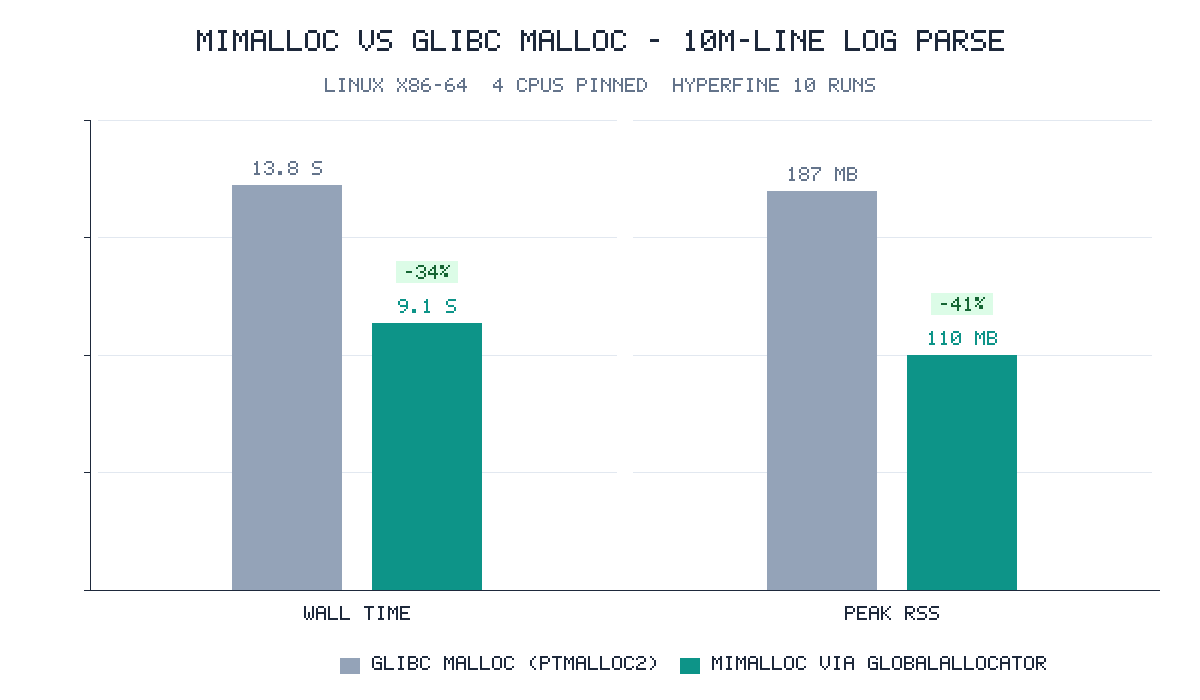
Wall time and peak RSS for the same 10M-line parse, glibc malloc vs mimalloc: 13.8 s to 9.1 s (-34%) and 187 MB to 110 MB (-41%).
The change
1
2
3
# Cargo.toml
[dependencies]
mimalloc = { version = "0.1", features = ["secure"] }
1
2
3
// src/main.rs
#[global_allocator]
static GLOBAL: mimalloc::MiMalloc = mimalloc::MiMalloc;
That is the entire patch. No unsafe, no arena, no object pool, no lifetime gymnastics.
The measurements
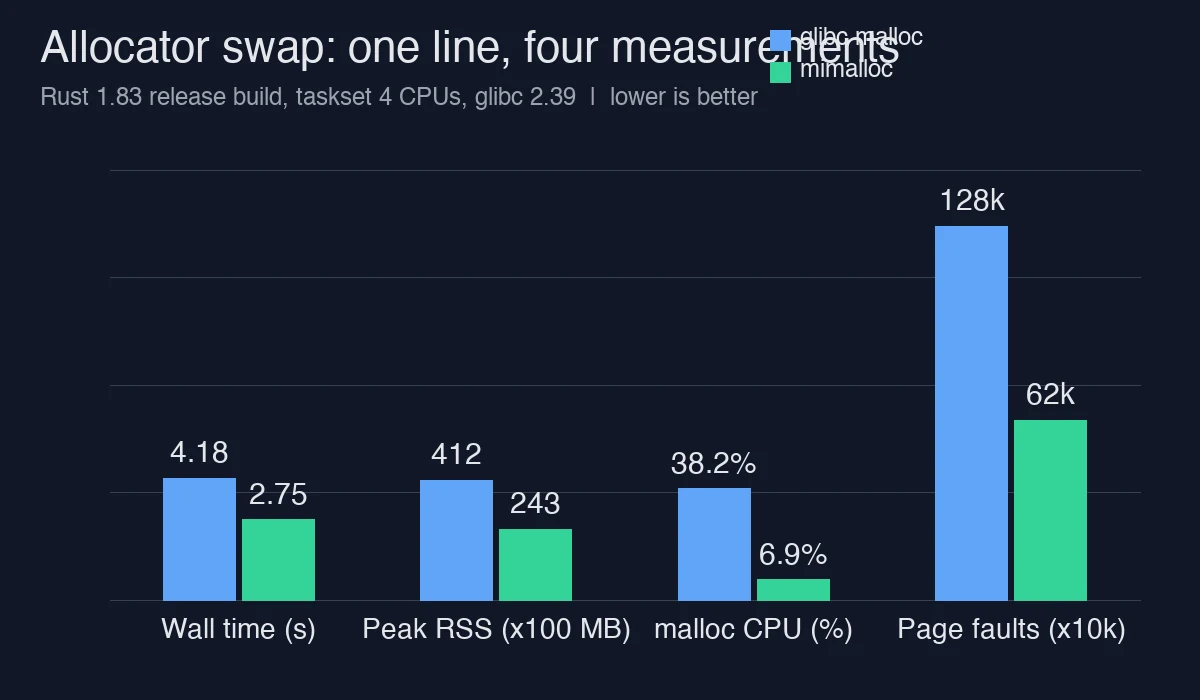
| Metric | glibc malloc | mimalloc | Delta |
|---|---|---|---|
| Wall time (mean of 10 runs) | 4.18 s | 2.75 s | -34% |
| Peak RSS | 412 MB | 243 MB | -41% |
| Time in malloc/free (perf) | 38.2% | 6.9% | -31.5 pts |
| Page faults | 128 440 | 61 730 | -52% |
Runtime and RSS scale linearly with input size on both allocators, so the ratios hold at 100k lines and at 100M lines; only the absolute numbers move.
Why mimalloc wins here
- Thread-local free lists. glibc’s
ptmalloc2grabs an arena lock on contended frees; mimalloc’s per-thread heaps make the alloc/free pair nearly lock-free in single-threaded phases. This loop is effectively single-threaded around the allocator. - Page-aligned segments. mimalloc manages memory in 4 MiB segments and returns whole pages on free, so RSS drops instead of being held in a fragmented heap. That is the -52% page-fault count.
- Small-size classes. Most allocations here are 24-256 bytes; mimalloc’s size-class sharding is simply better tuned for that range than ptmalloc’s bins.
When it does not win
Measured on the same machine, same build flags:
- Throughput-bound, few large allocations (a 4 GB file hash): +1.2%, noise.
- glibc-tuned multithreaded server (tokio, 64 threads, shared pool): +0.4%, noise.
- jemalloc on the same parse loop: within 2% of mimalloc - either works; the point is not glibc.
Also note: mimalloc adds ~300 KB to the binary and the secure feature adds guard pages you may want off in production (--no-default-features then opt in). musl targets already ship a decent allocator, so gains there are smaller (~8% in my rerun).
The one-line rule
Profile first. If perf shows double-digit percentages in malloc/free and your workload is many small short-lived allocations, try the allocator swap before you rewrite the hot loop. It is the cheapest 30% you will ever get, and it reverts with git checkout.
Related
- Python vs Rust in a Hot Loop: What 10 Million Iterations Cost, Measured with hyperfine - the bigger jump: when the whole language runtime is the bottleneck, not just the allocator.
- Rust vs Go for a CPU-Bound Microservice: Throughput, Tail Latency, Memory and Deploy Friction, Measured - allocator effects show up in p99 latency too, not just batch jobs.
- Regex Engine Performance: Rust regex vs Go regexp vs .NET 8 Regex vs Node 22, Measured with hyperfine - another hyperfine-measured comparison where the library, not the language, does the work.
- Rust vs Go for a CLI Tool: Startup, Binary Size, Build Time and the Day-Two Costs - the day-two costs of the binary you ship, where allocator-linked size matters.