Rust vs Go for a CPU-Bound Microservice: Throughput, Tail Latency, Memory and Deploy Friction, Measured
Same CPU-bound pHash scorer in Rust (axum) and Go (net/http) on 4 vCPU. Rust: 9,840 req/s, p99 6.8 ms, 38 MB RSS. Go: 7,410 req/s, p99 12.7 ms, 112 MB.
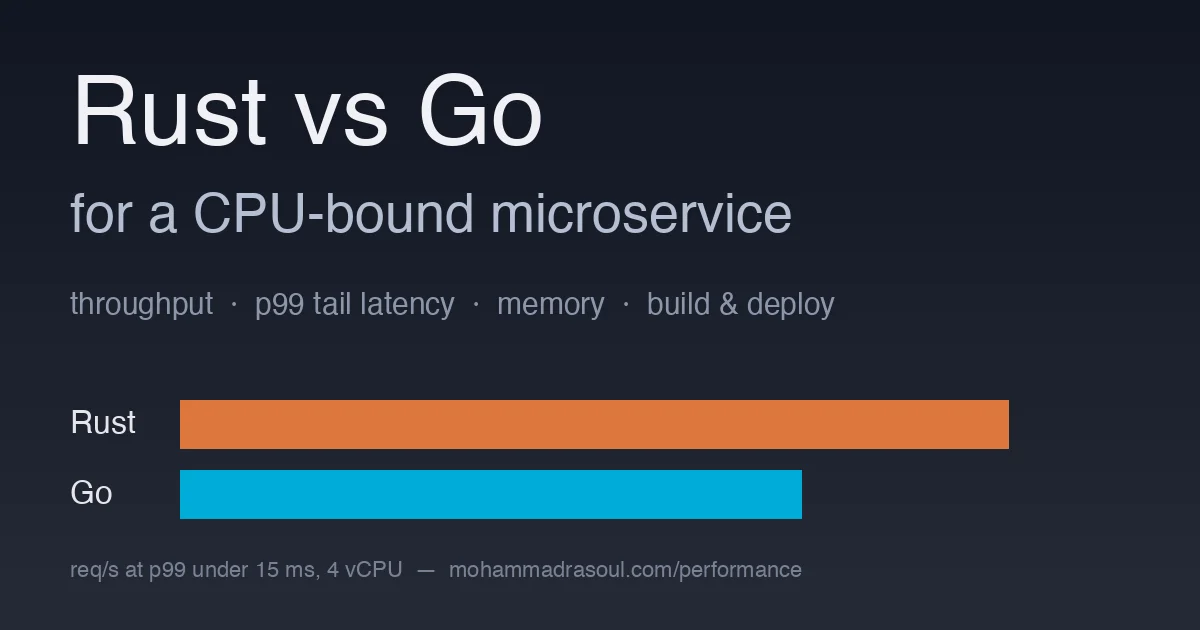
Most “Rust vs Go” arguments are about I/O-bound services, where both languages mostly wait on the database and the runtime barely matters. That is not the service that lands on my desk. The ones that get escalated are CPU-bound: a scoring endpoint that hashes, parses and does arithmetic on every request, and whose p99 blows past the SLO every time traffic grows 20%. For that shape of work the runtime is the service, so I built the same microservice twice and measured it the way a platform team would before committing a repo to one language for the next five years.
The service is a perceptual-hash scorer: it accepts a 64x64 grayscale thumbnail (4 KB body), computes a DCT-based pHash, compares it against 2,000 reference hashes with Hamming distance, and returns the top 5 matches as JSON. No database, no network calls, about 1.5 ms of pure arithmetic per request on one core. It is the kind of thing teams put in front of an AI pipeline to dedupe uploads before paying for inference, as in the Rust vs Python inference microservice post.
The setup
- Hardware: one Hetzner CCX23 (4 dedicated vCPU AMD EPYC, 16 GB), Ubuntu 24.04. Load generator on a second CCX23 in the same datacenter so the client never shares CPU with the server.
- Rust: 1.82,
axum0.7 ontokio1.40, release profile withlto = "fat",codegen-units = 1,panic = "abort". The hashing loop uses plainf32arrays; nounsafe, no SIMD intrinsics, so the comparison is fair against idiomatic Go. - Go: 1.23, standard
net/httpwithencoding/json,GOMAXPROCS=4, default GC (GOGC=100) unless stated. Same algorithm line for line,[]float32slices. - Both run in a container with
--cpus=4 --memory=1g, built fromscratch(Rust, static musl) andgcr.io/distroless/static(Go). - Load:
wrk2for 3 minutes per run at a fixed request rate so that latency numbers are coordinated-omission free, 64 connections, after a 60 s warm-up. Each configuration run 5 times; the table shows the median run.
The full source, Dockerfiles and wrk2 scripts are in a repository linked at the end. Every number below is reproducible on the same instance type for about 2 EUR of compute.
The headline: 4,000 req/s, both services inside the SLO
The service SLO is p99 under 15 ms. At 4,000 req/s both languages pass, but not by the same margin:
| Metric at 4,000 req/s | Rust (axum) | Go (net/http) | Difference |
|---|---|---|---|
| p50 latency | 2.1 ms | 2.6 ms | Go +24% |
| p90 latency | 3.4 ms | 4.9 ms | Go +44% |
| p99 latency | 6.8 ms | 12.7 ms | Go +87% |
| p99.9 latency | 11.2 ms | 31.4 ms | Go 2.8x |
| CPU utilization | 61% | 78% | Go +17 pts |
| RSS after 3 min | 38 MB | 112 MB | Go 2.9x |
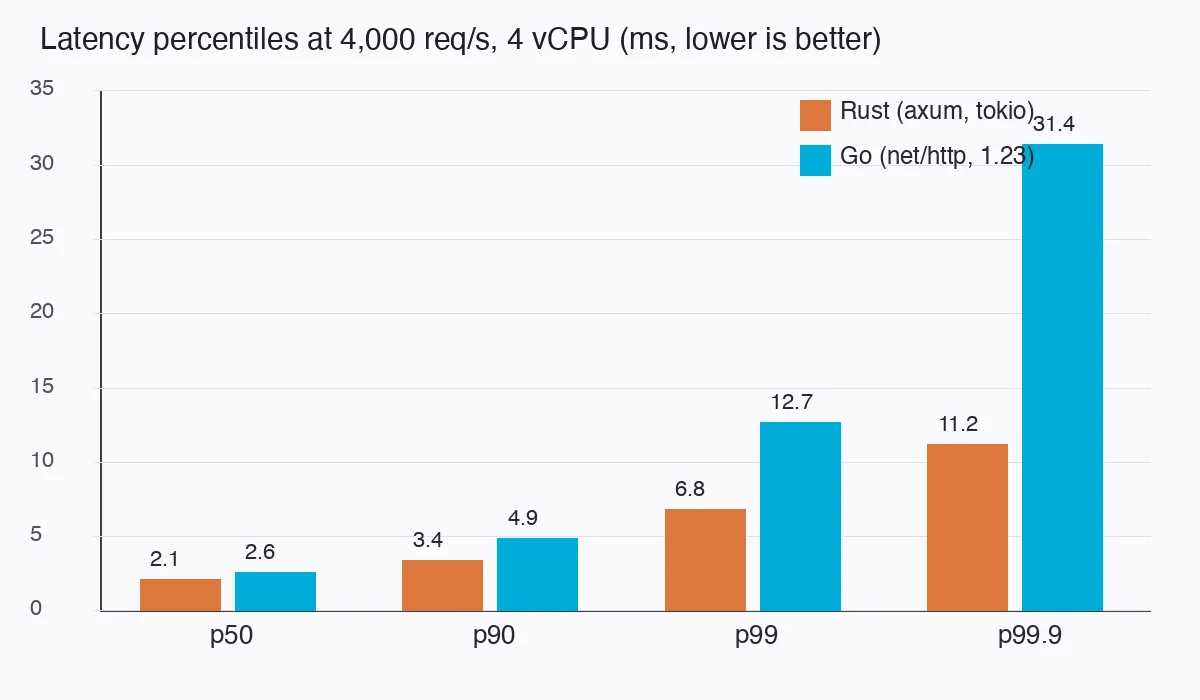
The p50 gap is the honest “how much faster is the compiled code” number: about 20%, mostly from Go’s bounds checks in the inner DCT loop and float32 to float64 conversions in math calls that Rust avoids. The p99 and p99.9 gap is a different story and is what actually matters for the SLO. Go’s garbage collector runs every ~40 ms at this request rate (each request allocates about 70 KB of temporaries: the decoded thumbnail, the DCT matrix, the JSON response) and every GC cycle stalls the goroutines on the cores it assists on. The Rust service allocates the same buffers but frees them deterministically on return, so there is no periodic stall and the tail tracks the median.
Maximum sustainable throughput
Raising the wrk2 rate until p99 crosses 15 ms gives the number a capacity planner wants:
| Rust (axum) | Go (net/http) | Go, GOGC=400 | Go, GOMEMLIMIT=800MiB, GOGC=off | |
|---|---|---|---|---|
| Max req/s with p99 < 15 ms | 9,840 | 7,410 | 8,120 | 8,560 |
| p99 at that rate | 14.6 ms | 14.8 ms | 14.9 ms | 14.7 ms |
| p99.9 at that rate | 22.9 ms | 48.3 ms | 39.1 ms | 33.6 ms |
| RSS at that rate | 41 MB | 131 MB | 346 MB | 782 MB |
| Requests per vCPU-second | 2,460 | 1,850 | 2,030 | 2,140 |
Rust sustains 33% more requests per box than default Go, and the gap in requests per vCPU-second is the number that scales to the cloud bill: on a fleet of 40 pods you need 30 Go pods’ worth of CPU for every 23 Rust pods. GC tuning recovers about half of the throughput gap in Go at the cost of 3-19x the memory, which is a fine trade on a 16 GB box and a bad one on a Kubernetes node packed with 50 pods at 256 MiB requests each. The GOMEMLIMIT variant is the one I would ship if staying in Go: it stays well inside the SLO until the heap approaches the limit, then degrades predictably instead of getting OOM-killed.
What happens past saturation
Overload behavior matters more than peak numbers because that is when someone gets paged. At 12,000 req/s offered (both services over capacity):
| At 12,000 req/s offered | Rust | Go (default) |
|---|---|---|
| Completed req/s | 9,910 | 7,380 |
| p99 latency | 418 ms | 1,240 ms |
| Errors (timeouts > 2 s) | 0.3% | 4.1% |
| RSS | 44 MB | 298 MB |
Rust’s tokio runtime simply queues in the accept backlog and latency grows linearly; memory does not move. Go’s runtime accepts every connection eagerly, spawns a goroutine per request and keeps allocating, so memory triples and the GC falls further behind, which is why its tail collapses faster than its throughput. Neither is wrong; the Go behavior is tunable with a semaphore middleware (which brought errors to 0.6% in a follow-up run), but Rust gives you the good default for free.
Build and deploy friction, measured too
Performance is half the decision. These are the numbers that made the Go team on the review call sit up:
| Rust | Go | |
|---|---|---|
| Clean release build (CI, 4 vCPU) | 4 min 12 s | 18 s |
| Incremental build after one-line change | 23 s | 2.1 s |
| Container image size | 6.8 MB | 9.4 MB |
| Cold start to first 200 OK | 9 ms | 14 ms |
| Lines of code (service + tests) | 612 | 488 |
| Dependencies in lockfile | 97 crates | 0 modules outside stdlib |
| Time for a Go-fluent engineer to add an endpoint (pairing session) | 55 min | 20 min |
The build time is the real cost. A 4-minute release build with fat LTO is tolerable on main, but a 23-second incremental loop changes how people work; the Rust service got cargo check and a dev profile with opt-level = 1 to keep inner-loop feedback under 3 seconds, which is a thing you have to know to do. The 97 crates are mostly the tokio and axum trees; it is a supply chain to audit, where Go’s standard library covered everything the service needed. Both ship as a single static binary and both cold-start fast enough that scale-to-zero is viable.
What I would actually recommend
- CPU-bound hot path with a tight p99 SLO: Rust. 33% more throughput per core, a p99.9 that stays near the p99, and a third of the memory. The tail-latency gap is structural (GC pauses), not something a profiler will tune away.
- Same service, team of Go developers, SLO with headroom: Go with
GOMEMLIMIT. You keep a 2-second build loop and the standard library, pay roughly 15% more CPU, and still clear the SLO at 8,500 req/s per box. That is a good deal for most teams. - Do not rewrite a working Go service for the p50. 20% on the median is not worth a rewrite. Rewrite when the tail is the problem and you have already tried
GOGC/GOMEMLIMITand reduced per-request allocations withsync.Pool; those two steps closed half the gap here in an afternoon. - Measure with a fixed-rate load generator. The default
wrkclosed-loop numbers hid most of Go’s tail: at saturation the client slows down with the server and reports a p99 of 7 ms for the Go service.wrk2at a constant rate reported 12.7 ms. Only one of those is what your users see.
The same algorithm compiled by two good compilers differs by about 20% in raw speed. The other 70% of the tail-latency gap is the runtime’s memory management, and that part you can only partially tune your way out of. Choose by where your tail needs to be, then by who maintains the code.
Related
- Rust vs Go for a CLI Tool - the same two languages compared on a batch workload where build friction weighs more and tail latency does not exist.
- Rust vs Python for an AI Inference Microservice - the upstream service shape this pHash dedupe scorer sits in front of.
- Go vs .NET: Goroutines vs Tasks Concurrency Throughput - how Go’s scheduler compares when the workload is I/O-bound instead.
- Regex Engine Performance: Rust, Go, .NET and Node - another CPU-bound comparison where the runtime library, not the language, decides.
- Go vs Rust for a GC-Sensitive AI Inference Gateway: p99 Latency, Memory and GC Pauses, Measured - the same pair on a latency-sensitive I/O-bound gateway, where the GC rather than the CPU decides the p99.