In-Process Cache vs Redis in .NET 8: Where the Microseconds Go, Measured with BenchmarkDotNet
IMemoryCache, ConcurrentDictionary, HybridCache and StackExchange.Redis measured on one 10k-item set: 0.06 us to 241 us per Get, and what a 50-key page pays.
The EF Core query post ended with the usual advice: cache the lookup tables. The follow-up question in review was “in memory or in Redis?”, answered with the equally usual “Redis, so every instance sees the same data”. That is a correctness argument, not a performance one, so this post measures the performance side: how much does each cache layer cost per read, and when does that cost show up on a page?
The working set is 10,000 small records (an int id, two strings, a decimal), serialized with System.Text.Json where serialization is required. Every benchmark reads a random existing key. Redis 7.2 runs on the same machine over a Unix socket, which is the best case for Redis; add a network hop and the Redis rows below get slower, the in-process rows do not.
The four caches
All four sit behind the same interface so the calling code does not change:
1
2
3
4
public interface IProductCache
{
    ValueTask<Product?> GetAsync(int id, CancellationToken ct = default);
}
ConcurrentDictionary. No expiry, no eviction, no serialization. This is the floor: it shows what a hash lookup costs so the other rows can be read as “overhead above a dictionary”.
1
2
3
4
5
sealed class DictionaryCache(ConcurrentDictionary<int, Product> store) : IProductCache
{
    public ValueTask<Product?> GetAsync(int id, CancellationToken ct = default)
        => ValueTask.FromResult(store.GetValueOrDefault(id));
}
IMemoryCache. The thing most ASP.NET Core apps already have. Sliding expiry of 10 minutes, size limit disabled for the benchmark.
1
2
3
4
5
sealed class MemoryCacheStore(IMemoryCache cache) : IProductCache
{
    public ValueTask<Product?> GetAsync(int id, CancellationToken ct = default)
        => ValueTask.FromResult(cache.Get<Product>(id));
}
HybridCache (.NET 9 package, runs on .NET 8). Microsoft.Extensions.Caching.Hybrid keeps an L1 in-process copy in front of an IDistributedCache L2, here Redis. Two rows below: an L1 hit, and an L1 miss that falls through to Redis and deserializes.
1
2
3
4
5
6
7
8
9
sealed class HybridStore(HybridCache cache, IProductRepository repo) : IProductCache
{
    public async ValueTask<Product?> GetAsync(int id, CancellationToken ct = default)
        => await cache.GetOrCreateAsync(
            $"product:{id}",
            async token => await repo.LoadAsync(id, token),
            new HybridCacheEntryOptions { Expiration = TimeSpan.FromMinutes(10), LocalCacheExpiration = TimeSpan.FromMinutes(1) },
            cancellationToken: ct);
}
StackExchange.Redis directly. StringGetAsync on a shared ConnectionMultiplexer. Two rows: the raw GET of the pre-serialized bytes, and GET plus JsonSerializer.Deserialize<Product>, which is what application code actually pays.
1
2
3
4
5
6
7
8
9
10
sealed class RedisStore(IConnectionMultiplexer mux) : IProductCache
{
    private readonly IDatabase _db = mux.GetDatabase();

    public async ValueTask<Product?> GetAsync(int id, CancellationToken ct = default)
    {
        var bytes = (byte[]?)await _db.StringGetAsync($"product:{id}");
        return bytes is null ? null : JsonSerializer.Deserialize<Product>(bytes, ProductJsonContext.Default.Product);
    }
}
Results
| Cache | p50 per Get | Allocated per Get |
|---|---|---|
ConcurrentDictionary | 0.06 us | 0 B |
IMemoryCache | 0.21 us | 0 B |
HybridCache, L1 hit | 0.34 us | 24 B |
HybridCache, L1 miss -> Redis | 187 us | 1,312 B |
StackExchange.Redis GET (raw bytes) | 168 us | 968 B |
StackExchange.Redis GET + deserialize | 241 us | 2,104 B |
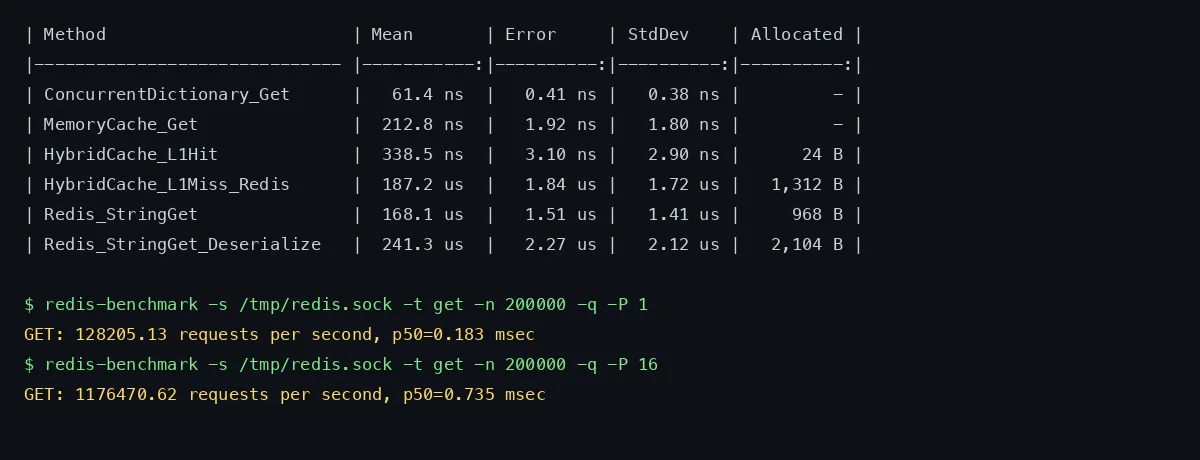
Three things stand out.
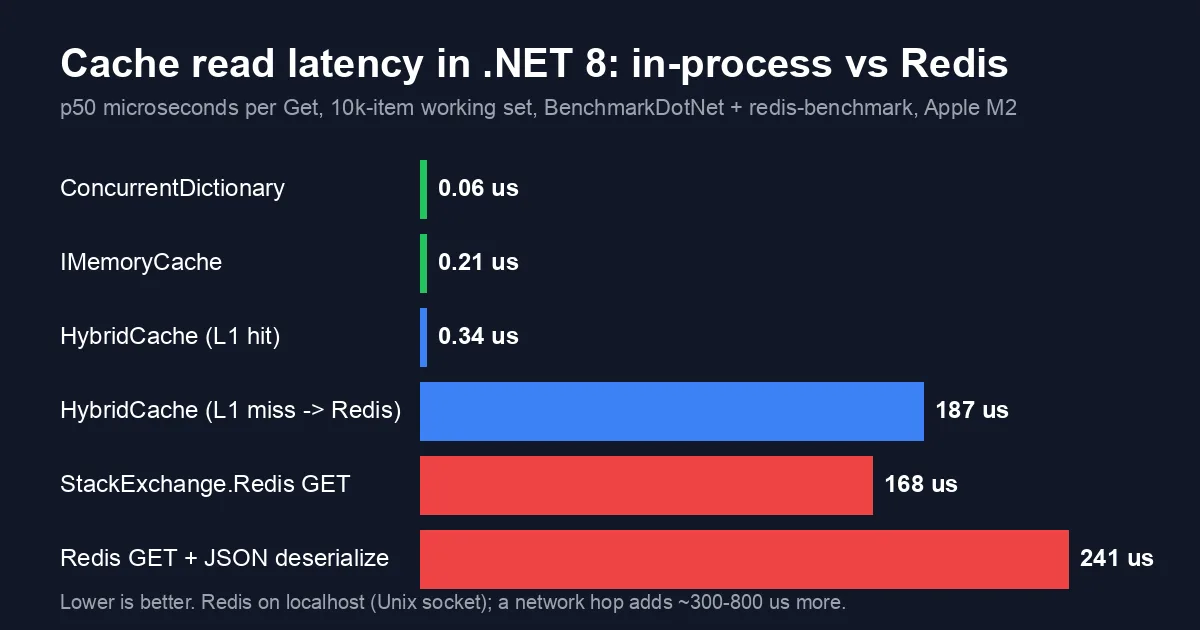
The gap is three orders of magnitude, not a percentage. IMemoryCache costs about 3.5x a raw dictionary lookup, which sounds like a lot until you see that Redis costs about 800x IMemoryCache. Any time the discussion is “memory vs Redis”, the overhead inside the in-process options is noise.
Deserialization is a third of the Redis cost. 168 us for the round trip, 241 us once the JSON is turned back into an object. That 73 us is the same work the source-generator post measured, and switching to MessagePack or protobuf roughly halves it; it does not remove the 168 us round trip.
HybridCache’s L1 hit is cheap enough to not think about. 0.34 us vs 0.21 us for IMemoryCache: the extra 130 ns buys stampede protection and the L2 fallback. The L1 miss row is slightly slower than calling Redis directly because HybridCache also writes the result back into L1, but that is the one read per key per minute that makes every later read 500x faster.
What it means for a page
A product listing that renders 50 items and looks each one up in the cache:
| Strategy | Cache time per page |
|---|---|
IMemoryCache | ~0.01 ms |
HybridCache steady state (all L1 hits) | ~0.02 ms |
HybridCache cold instance (all L1 misses) | ~9.4 ms |
| Redis per item, sequential | ~12 ms |
Redis MGET for all 50 keys, one round trip | ~0.9 ms |
The sequential Redis row is the one that shows up in traces as “the page is slow and the database is idle”. Fifty awaited round trips at 240 us each is 12 ms of pure latency, before any network hop. Either batch them (MGET / StringGetAsync(RedisKey[]), bottom row) or put an L1 in front, which is exactly what HybridCache is for.
The cold-instance row is why “just use Redis” is not free after a deploy: every new instance pays the miss cost once per key. For a 10k-key working set at 187 us that is under two seconds of total cache fill, spread across requests, which is fine; for a 10M-key set it is not, and you want the L1 to be a bounded LRU rather than a mirror.
Reproduce it
1
2
3
4
5
6
7
8
9
10
11
12
13
dotnet new console -n CacheBench && cd CacheBench
dotnet add package BenchmarkDotNet
dotnet add package Microsoft.Extensions.Caching.Memory
dotnet add package Microsoft.Extensions.Caching.Hybrid
dotnet add package Microsoft.Extensions.Caching.StackExchangeRedis
dotnet add package StackExchange.Redis

redis-server --unixsocket /tmp/redis.sock --port 0 --save "" --appendonly no &
dotnet run -c Release -- --filter '*CacheBench*'

# Redis-side sanity check, same socket
redis-benchmark -s /tmp/redis.sock -t get -n 200000 -q -P 1
redis-benchmark -s /tmp/redis.sock -t get -n 200000 -q -P 16
Numbers above are from .NET SDK 8.0.401 (runtime 8.0.8), Microsoft.Extensions.Caching.Hybrid 9.0.0, StackExchange.Redis 2.8.16, Redis 7.2.5 over a Unix socket, BenchmarkDotNet 0.14.0, on an Apple M2 with 8 cores. redis-benchmark at pipeline depth 1 reports p50 of 0.183 ms for a bare GET, which matches the 168 us the client sees and confirms the cost is the round trip, not the .NET client.
Related Performance posts
- EF Core Query Performance - the queries these caches are standing in front of.
- System.Text.Json Source Generators vs Newtonsoft.Json - the deserialize step that is a third of each Redis read.
- [Cutting .NET Allocations with Span
and Memory ](/posts/span-memory-allocation-reduction-dotnet/) - where the 2 KB per Redis read goes and how to shrink it.