EF Core Query Tuning: AsNoTracking, Split Queries and Compiled Queries Measured with BenchmarkDotNet
Tune EF Core read paths with AsNoTracking, AsSplitQuery, projections and compiled queries. Benchmark table shows a 42 ms query dropping to under 7 ms.
After allocations in hot loops (see [the Span
This post takes one realistic query, an order list page with its lines and customer, and applies four changes one at a time: AsNoTracking(), AsSplitQuery(), a projection to a DTO, and a compiled query. Every step is measured with BenchmarkDotNet against a local SQL Server 2022 container on .NET 8 and EF Core 8. Absolute numbers depend on your hardware and data; the ratios are what travel.
The model and the data
1
2
3
4
5
6
7
8
9
10
11
12
13
14
15
16
17
18
19
public class Customer { public int Id { get; set; } public string Name { get; set; } = ""; }

public class Order
{
    public int Id { get; set; }
    public DateTime PlacedAt { get; set; }
    public int CustomerId { get; set; }
    public Customer Customer { get; set; } = null!;
    public List<OrderLine> Lines { get; set; } = new();
}

public class OrderLine
{
    public int Id { get; set; }
    public int OrderId { get; set; }
    public string Sku { get; set; } = "";
    public int Quantity { get; set; }
    public decimal UnitPrice { get; set; }
}
The database is seeded with 200 customers, 20,000 orders and 5 lines per order. Each benchmark loads the 500 most recent orders with their lines and customer, which is the shape of a typical “recent orders” admin page.
Step 0: the baseline everyone writes
1
2
3
4
5
6
7
8
9
10
public async Task<List<Order>> Baseline()
{
    using var db = _factory.CreateDbContext();
    return await db.Orders
        .Include(o => o.Customer)
        .Include(o => o.Lines)
        .OrderByDescending(o => o.PlacedAt)
        .Take(500)
        .ToListAsync();
}
Two things are happening under the hood:
- Change tracking. Every entity that comes back is snapshotted so
SaveChangescan later detect modifications. For 500 orders, 500 customers (many duplicated) and 2,500 lines that is 3,500 snapshots nobody will ever use on a read-only page. - A single joined query. Both
Includes are translated to one SQL statement with twoLEFT JOINs. BecauseLinesis a collection, each order row is repeated once per line: 500 x 5 = 2,500 rows, each carrying the full order and customer columns. This is the “cartesian explosion” that EF Core actually warns about in its logs.
Step 1: AsNoTracking()
1
2
3
4
5
6
7
return await db.Orders
    .AsNoTracking()
    .Include(o => o.Customer)
    .Include(o => o.Lines)
    .OrderByDescending(o => o.PlacedAt)
    .Take(500)
    .ToListAsync();
No SQL changes. EF Core skips snapshotting and identity resolution, so materialisation is cheaper and allocates much less. If you never call SaveChanges on the context, you can set it once in OnConfiguring with UseQueryTrackingBehavior(QueryTrackingBehavior.NoTracking) instead of sprinkling it everywhere.
If the same customer appears on several orders, no-tracking queries give you separate
Customerinstances. UseAsNoTrackingWithIdentityResolution()when your code relies on reference equality; it costs a little more than plainAsNoTracking()but still avoids snapshots.
Step 2: AsSplitQuery()
1
2
3
4
5
6
7
8
return await db.Orders
    .AsNoTracking()
    .AsSplitQuery()
    .Include(o => o.Customer)
    .Include(o => o.Lines)
    .OrderByDescending(o => o.PlacedAt)
    .Take(500)
    .ToListAsync();
Now EF Core sends two statements: one for the 500 orders joined to customers, and a second one for the lines of those 500 orders. Rows go from 2,500 wide rows to 500 + 2,500 narrow ones, and the order and customer columns stop being duplicated five times. The cost is one extra round trip and a consistency caveat: without a transaction, the two statements can observe different snapshots of the data. For a listing page that is fine; for anything that drives a financial decision, wrap it in a serializable transaction or stay with a single query.
Step 3: project to a DTO
Most pages do not need the whole entity. Projecting with Select lets EF Core fetch only the columns the page renders and skip entity materialisation entirely:
1
2
3
4
5
6
7
8
9
10
11
12
public record OrderRow(int Id, DateTime PlacedAt, string Customer, int LineCount, decimal Total);

return await db.Orders
    .OrderByDescending(o => o.PlacedAt)
    .Take(500)
    .Select(o => new OrderRow(
        o.Id,
        o.PlacedAt,
        o.Customer.Name,
        o.Lines.Count,
        o.Lines.Sum(l => l.Quantity * l.UnitPrice)))
    .ToListAsync();
The Count and Sum become correlated subqueries, so 500 rows with five columns come back instead of 2,500 rows with twenty. Projections are implicitly no-tracking, so you can drop AsNoTracking() here.
Step 4: compile the query
Every time a LINQ query runs, EF Core has to translate the expression tree to SQL. It caches the translation, but it still has to walk the tree and compute a cache key on each call. EF.CompileAsyncQuery does that work once:
1
2
3
4
5
6
7
8
9
10
11
12
13
14
15
16
private static readonly Func<AppDbContext, IAsyncEnumerable<OrderRow>> RecentOrders =
    EF.CompileAsyncQuery((AppDbContext db) =>
        db.Orders
          .OrderByDescending(o => o.PlacedAt)
          .Take(500)
          .Select(o => new OrderRow(
              o.Id, o.PlacedAt, o.Customer.Name,
              o.Lines.Count, o.Lines.Sum(l => l.Quantity * l.UnitPrice))));

public async Task<List<OrderRow>> Compiled()
{
    using var db = _factory.CreateDbContext();
    var rows = new List<OrderRow>(500);
    await foreach (var r in RecentOrders(db)) rows.Add(r);
    return rows;
}
On a query this size the compilation overhead is a small fraction of the total, so the gain over step 3 is modest. Compiled queries pay off most on tiny, very frequent queries (lookups by key on a hot API) where translation is a measurable share of the request.
The numbers
1
2
3
4
5
6
7
8
9
[MemoryDiagnoser]
public class EfCoreBenchmarks
{
    [Benchmark(Baseline = true)] public Task<List<Order>> Baseline() => ...;
    [Benchmark] public Task<List<Order>> NoTracking() => ...;
    [Benchmark] public Task<List<Order>> NoTrackingSplit() => ...;
    [Benchmark] public Task<List<OrderRow>> Projection() => ...;
    [Benchmark] public Task<List<OrderRow>> Compiled() => ...;
}
| Method | Mean | Ratio | SQL statements | Rows returned | Allocated |
|---|---|---|---|---|---|
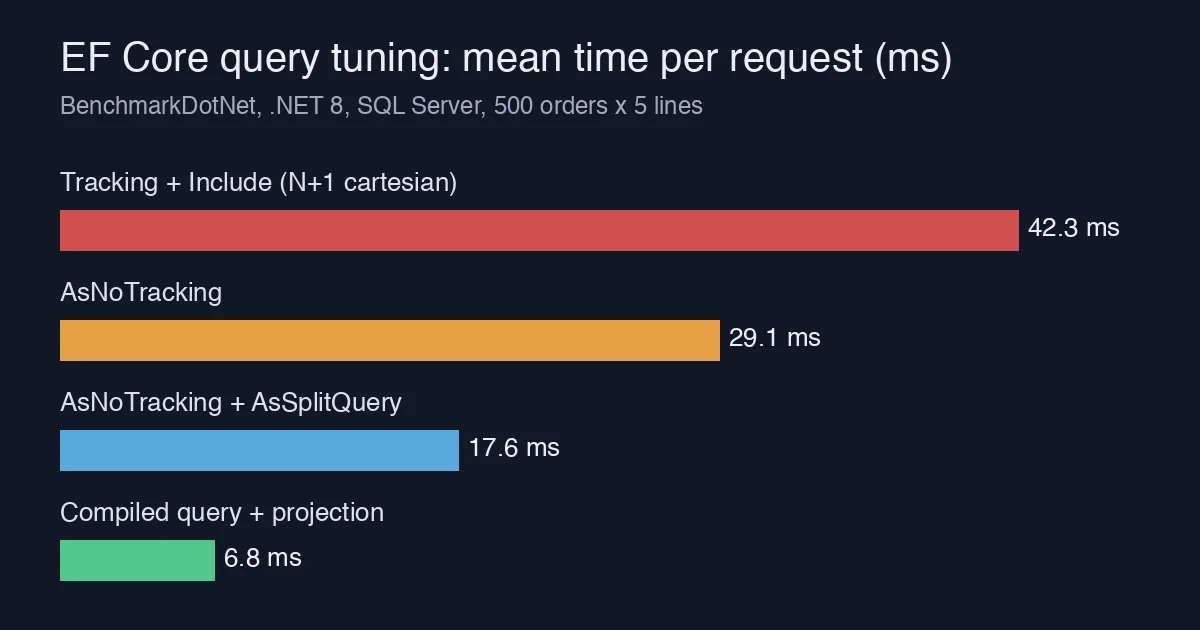
| Baseline | 42.31 ms | 1.00 | 1 | 2,500 | 11.84 MB |
| NoTracking | 29.08 ms | 0.69 | 1 | 2,500 | 6.21 MB |
| NoTrackingSplit | 17.62 ms | 0.42 | 2 | 500 + 2,500 | 3.37 MB |
| Projection | 7.44 ms | 0.18 | 1 | 500 | 0.41 MB |
| Compiled | 6.81 ms | 0.16 | 1 | 500 | 0.38 MB |
Three observations:
- Tracking is a third of the baseline cost on a read path. It is the cheapest fix in the list because it is one method call with no behavioural risk for read-only code.
- The split query halves what is left by eliminating duplicated columns, at the price of a second round trip. Measure it: on a high-latency link to the database the extra round trip can cancel the win.
- Projection beats everything because it changes what the database sends, not just how EF Core handles it. Compiled queries add a few percent on top.
Checklist for your own codebase
- Turn on
LogToorEnableSensitiveDataLoggingin development and look for theMultipleCollectionIncludeWarning. Every hit is a split-query or projection candidate. - Default read-only contexts to
NoTrackingand opt in to tracking only where you callSaveChanges. - Prefer
Selectinto DTOs for list pages; keepIncludefor code that actually edits the graph. - Reach for
EF.CompileQueryonly after the first three, and only on queries you can prove run thousands of times per minute. - Re-run the benchmark after each change. Several of these “obvious” wins are environment-dependent, and the table above is the only reason I trust the ordering.
The full benchmark project is about 150 lines; the structure above is enough to reproduce it against your own schema.