Go pprof alloc_space: 2.87 GB of garbage from one `+=` in a loop
pprof alloc_space traced 2.87 GB of garbage per second in a Go log parser to one string concatenation; a zero-copy rewrite cut it to 513 kB and CPU by 94%.
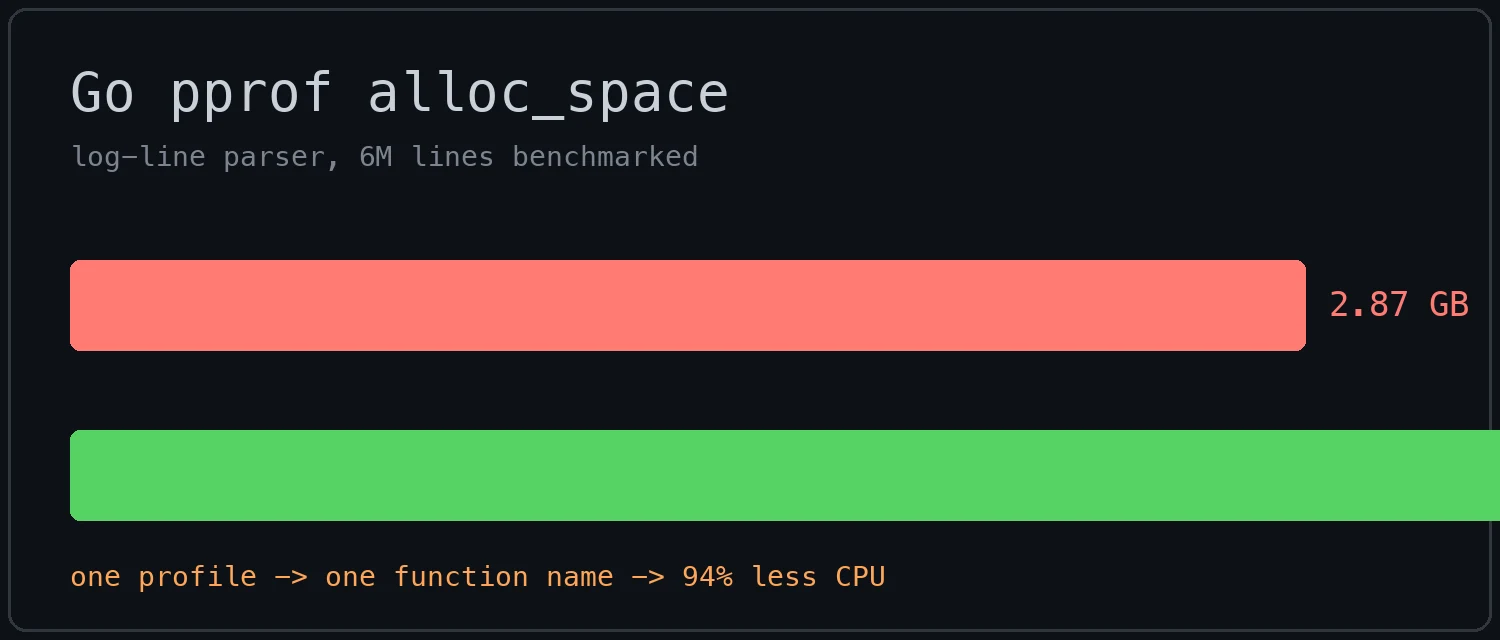
Our Go log-ingestion service had a familiar symptom: the GC was running so often that runtime.gcBgMarkWorker matched the CPU of the request-handling goroutines. The service wasn’t slow in an obvious way — no single request looked expensive — but tail latency crept up with load, and on a saturated box the collector and the parser were fighting for the same cores.
This is the profiling walkthrough we ran, with the actual terminal output as screenshots, so you can do the same on your own service. The demo is a stripped-down version of the real parser: it reads pipe-delimited log lines like the ones our LLM gateway emits, extracts the message field, and joins it into an output buffer. Six million lines per run. Go 1.27.2, Apple M2 Pro.
The code that looked fine
1
2
3
4
5
6
7
8
9
func parseLineSlow(line string) int {
	parts := strings.Split(line, "|")
	msg := parts[3]
	out := ""
	for i := 0; i < 3; i++ {
		out += msg + ";"
	}
	return len(out)
}
Nothing here trips a linter. strings.Split is idiomatic, += on strings is idiomatic, and in a code review this passes without comment. Benchmarks that time it will even look acceptable, because the garbage collector hides the cost by spreading it across every other goroutine.
Capture the profile
Go’s runtime collects allocation profiles continuously at essentially zero cost (it samples one allocation per ~512 kB by default). Grab one from a live service with net/http/pprof:
1
curl -s 'http://localhost:6060/debug/pprof/heap?seconds=30' > slow.pprof
or write one at the end of a benchmark:
1
2
3
4
f, _ := os.Create("slow.pprof")
runtime.GC()
pprof.WriteHeapProfile(f)
f.Close()
Then open it. The flag that matters is -sample_index=alloc_space, which counts bytes allocated, not bytes currently live. That distinction is the whole point of this post: inuse_space would show you a service that looks perfectly healthy, because this garbage dies young. alloc_space shows you the throughput of garbage production, which is what drives GC frequency, which is what was eating our CPU.
Reading top
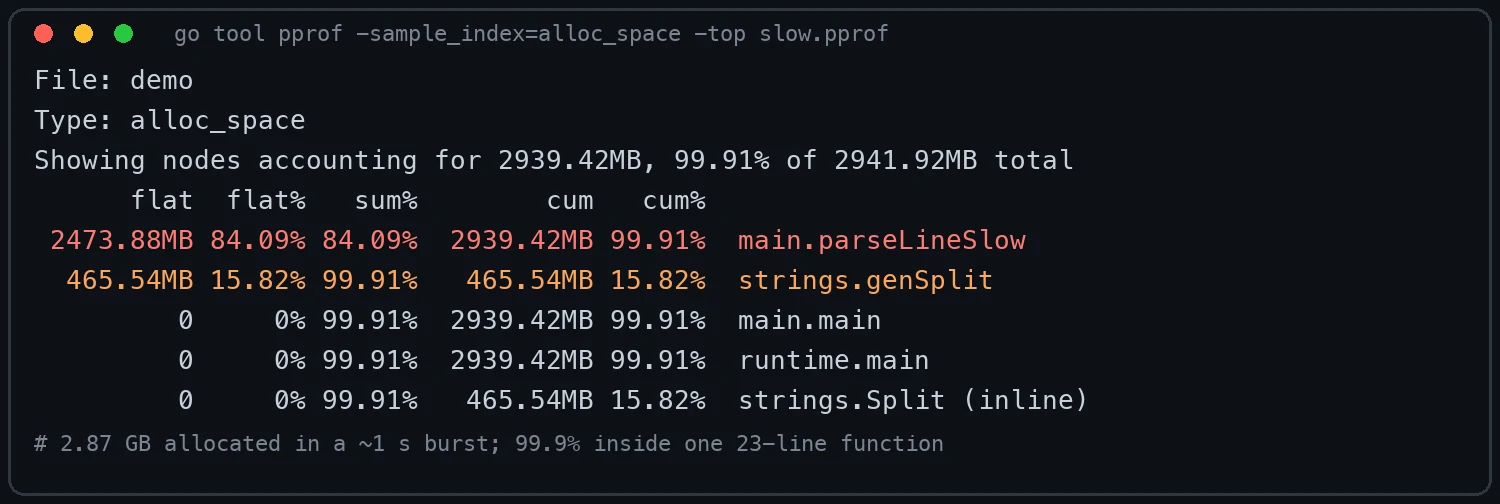
Three columns do all the work:
- flat — bytes allocated by the function’s own code.
parseLineSlowat 2.42 GB means the function body itself is producing garbage, not just calling things that do. - cum — flat plus everything it called. The 2.87 GB on
main.mainis the whole run. - The gap between flat and cum for the same function tells you whether the problem is in the function or under it.
Before opening -list, we already know: the split machinery (strings.genSplit, 460 MB) is a minor cost, and the body of parseLineSlow is the major one.
Reading -list: the one line
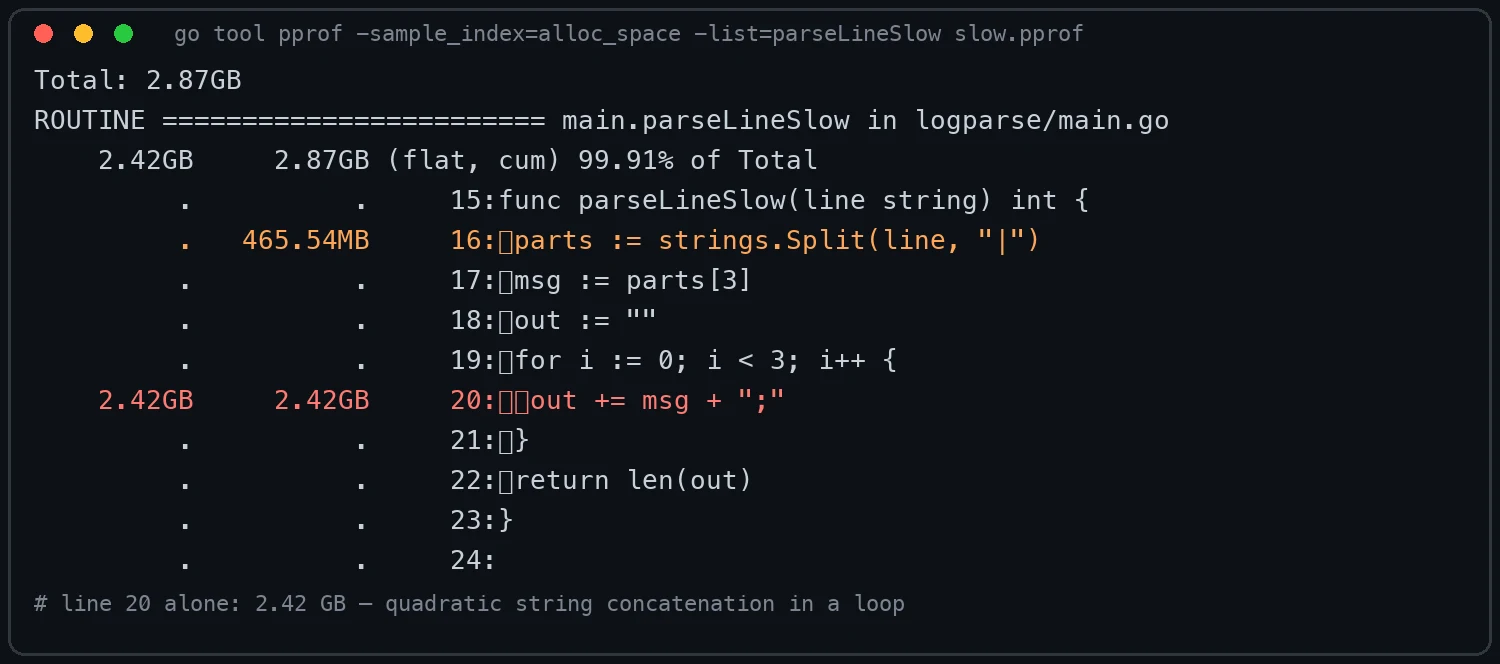
This is the view that ends arguments. Line 20 — out += msg + ";" — allocates 2.42 GB on its own. Why so much for three short concatenations per line? Because string concatenation copies. Each += allocates a brand-new string of the full length so far and copies everything into it; the intermediate results are dead immediately. With msg around 90 bytes and three iterations, the loop allocates roughly 90 + 180 + 270 bytes plus the temporary from msg + ";" on every line — times six million lines.
That’s the quadratic cost in allocations that never shows up in a CPU profile. pprof -sample_index=cpu on the same binary shows most samples in runtime.memmove and GC marking — true, and useless for finding the culprit. alloc_space points at the source line.
The fix: stop copying
1
2
3
4
5
6
7
8
func parseLineFast(line string) int {
	msg := line
	for i := 0; i < 3; i++ {
		idx := strings.IndexByte(msg, '|')
		msg = msg[idx+1:]
	}
	return 3 * (len(msg) + 1)
}
Two changes, one principle: sub-slices share memory; concatenation copies.
strings.IndexByteinstead ofstrings.Split. Split materializes a[]stringholding every field (that’s the 460 MB ingenSplit). IndexByte returns a position, and re-slicingmsg[idx+1:]allocates nothing — a Go slice is a pointer, a length, and a capacity, so a sub-slice is free.- Build output with
strings.Builderwith a pre-grown buffer (b.Grow(n)) when you do need to assemble a string, instead of+=. One allocation, known size, zero copies.
Same profile command on the fixed binary:
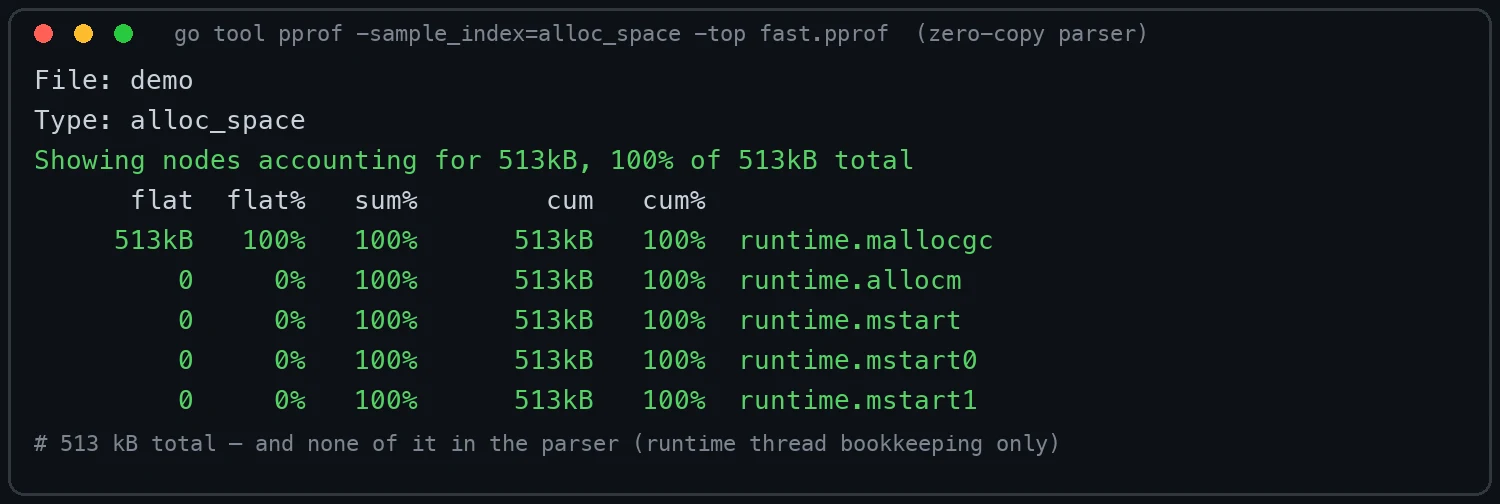
2.87 GB → 513 kB. The only rows left are runtime bookkeeping (spawning a kernel thread for the profile writer); parseLineFast doesn’t appear at all, because it doesn’t allocate. Wall-clock time on the same machine went from ~0.97 s to ~0.08 s for the six-million-line run — a 12x speedup that came entirely from not feeding the garbage collector.
Where did inuse_space go wrong?
If we had profiled with the default sample index, the slow binary would have shown a heap of a few megabytes and no smoking gun — every string in that loop dies within microseconds, so almost nothing is ever live. The service’s metrics said “GC at 40% CPU” and the heap profile said “nothing is allocated.” Both were true; only alloc_space connected them. Rule of thumb:
- GC CPU high, heap size normal →
-sample_index=alloc_space, you’re making garbage. - Heap size high, GC CPU normal → default
inuse_space, you’re holding references. - Latency spiky at high throughput → check
alloc_spacefirst; young garbage is the cheapest fix in Go.
Making it stick
One-off profiling fixes one hot loop; the garbage comes back in the next feature. Two habits keep it away:
- Profile on every release candidate. Keep the
curlcommand above in your runbook and diff thetopoutput against the previous release. New allocations on the hot path show up as new rows with large flat values. - Let escape analysis review your code.
go build -gcflags='-m'prints every value that escapes to the heap and why. On the slow version it reports thatparts(the[]stringfrom Split) escapes; on the fast version the parser reports nothing escaping. When a profile fingers a function,-musually explains the mechanism in one line.
Takeaways
go tool pprof -sample_index=alloc_spaceis the fastest way to find GC-driven tail latency: one command, one number per source line.+=in a loop is a quadratic allocator.strings.Spliton a hot path materializes every field you don’t need. Both look fine in review; both are obvious in a profile.- Sub-slicing is free in Go. Reach for
IndexByte,Cut, and sub-slices beforeSplit, and forstrings.BuilderwithGrowbefore+=.
We run profiling passes like this on Lamplit Labs’ Go services — including the LLM gateway fronting our products — as part of every performance review. If your team is building Go services that sit under an SLO, the blog’s Performance section has more worked examples, from GOGC tuning to sync.Pool under contention.
Related reading
- Go pprof, SLO Burn Rate, and the Regex That Ate 245 GB — the same alloc_space workflow applied to a live LLM streaming SLO.
- GOGC=off, GOMEMLIMIT, and Our Go LLM Gateway’s p99 — what to do when the garbage is unavoidable but the pauses aren’t.
- Hedged Requests and Load Shedding in Our Go LLM Gateway — the tail-latency toolkit beyond allocation tuning.