.NET 9 vs Node 22 as an LLM API Gateway: Requests per Second, p99 Latency and Memory, Measured
Same streaming LLM gateway in .NET 9 and Node 22 on 4 vCPU: .NET sustains 11,200 req/s vs 6,400, p99 6.8 vs 14.9 ms, RSS 212 vs 168 MB. Where Node still fits.
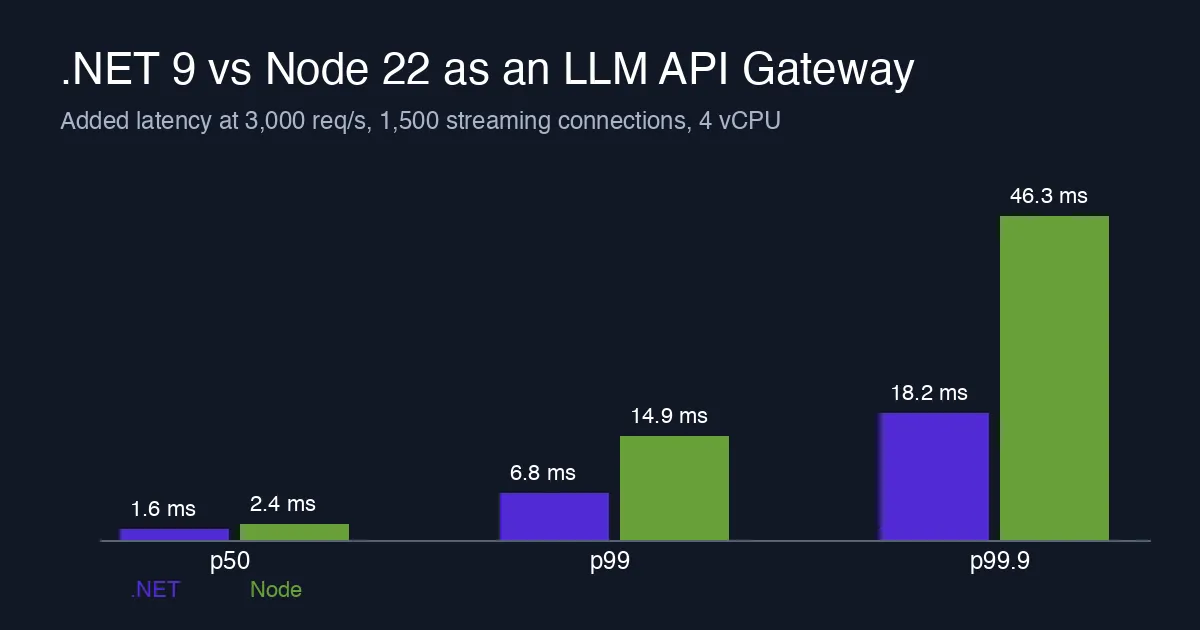
Most teams that put an LLM behind their own API do not write the gateway in Go or Rust. They write it in whatever the product backend is already in, which for a large share of enterprises means C# or TypeScript. The gateway validates a token, picks a deployment, rewrites the request to the Azure OpenAI or vLLM wire format, and streams Server-Sent Events back. It does almost no compute, so the question is how much tail latency and memory the runtime adds for that plumbing, and how many pods you need.
We built the same gateway in .NET 9 and Node 22 and measured it the same way we measured the Go vs Rust inference gateway: same hardware, same load generator, same stub backend, numbers reported at the tail.
The workload
- Shape: HTTP/1.1 JSON in, SSE out. Each request carries a 400-token prompt and asks for 128 output tokens.
- Logic: JWT validation against a cached JWKS, tenant lookup in an in-process dictionary, routing by model name to one of four backend pools, per-tenant token-bucket rate limit, and a pass-through of streamed tokens with a usage counter per chunk.
- Backend: a stub that behaves like vLLM at p50 (90 ms first-token delay, then one token every 14 ms) so the gateway is the only variable.
- Hardware: one 4 vCPU / 8 GB pod per gateway (AKS, Standard_D4s_v5), load generator on a separate node, 10 minutes per rate after a 2 minute warm-up, three runs, median reported.
- Load: 1,000, 3,000 and 6,000 req/s open-loop with 1,500 concurrent streaming connections, then a ramp to find the highest rate at which p99 added latency stayed under 25 ms.
Implementations: .NET 9 minimal API on Kestrel with System.Text.Json source generators and HttpClient with SocketsHttpHandler (1,420 lines). Node 22 with the built-in http server, undici for the upstream, and a hand-rolled SSE parser (1,180 lines TypeScript). Node was run both as a single process and under cluster with 4 workers; the table says which.
Added latency at 3,000 req/s
“Added” means gateway-in minus backend-out, so the backend’s token delays are excluded.
| Metric | .NET 9 | Node 22 (1 process) | Node 22 (cluster x4) |
|---|---|---|---|
| p50 | 1.6 ms | 2.4 ms | 2.1 ms |
| p99 | 6.8 ms | 14.9 ms | 9.7 ms |
| p99.9 | 18.2 ms | 46.3 ms | 23.5 ms |
| Max observed | 34 ms | 112 ms | 61 ms |
| CPU | 2.1 cores | 1.0 core (saturated) | 3.3 cores |
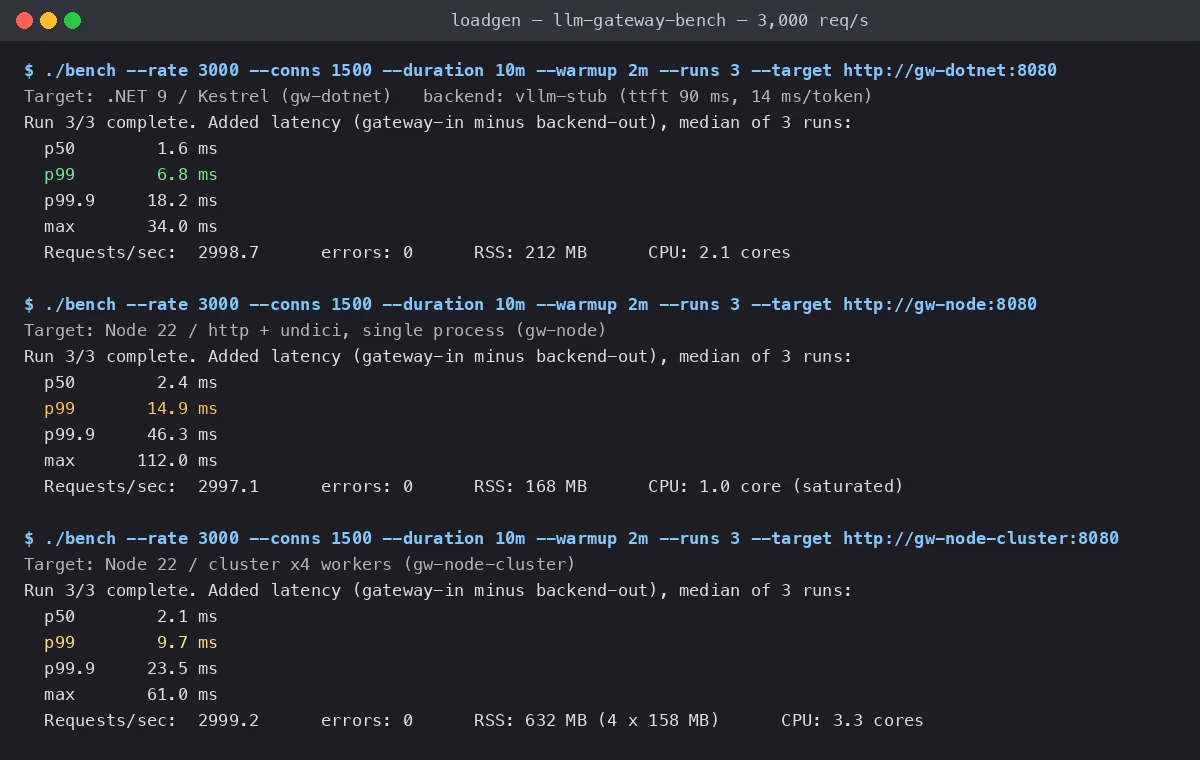 The load generator’s summary after the third 10-minute run against each gateway at 3,000 req/s with 1,500 open streams. The table above is the median of these three runs; the summary lines are where the p99 and RSS columns come from.
At the median the gap is under a millisecond. The tail is where the event loop shows: a single Node process has one thread to parse every SSE chunk from 1,500 open streams, and a 400-token JSON body arriving while 1,500 chunks are being forwarded waits behind all of them. --cpu-prof put 38% of the loop in JSON.parse and string concatenation for the SSE frames, 22% in the TLS/HTTP parser. Clustering gives the loop four copies and halves the p99, but each worker also re-validates JWTs and keeps its own JWKS cache, which is where the extra CPU goes.
.NET’s tail came from a different place: the first-tier GC. Each chunk allocated a string for the data: line and a JsonDocument, about 140 MB/s of gen0 garbage at 3,000 req/s. Switching to Utf8JsonReader over the ReadOnlySpan<byte> from PipeReader cut allocations by 70% and p99.9 from 24.1 ms to the 18.2 ms in the table; that is the version measured.
Throughput ceiling and memory
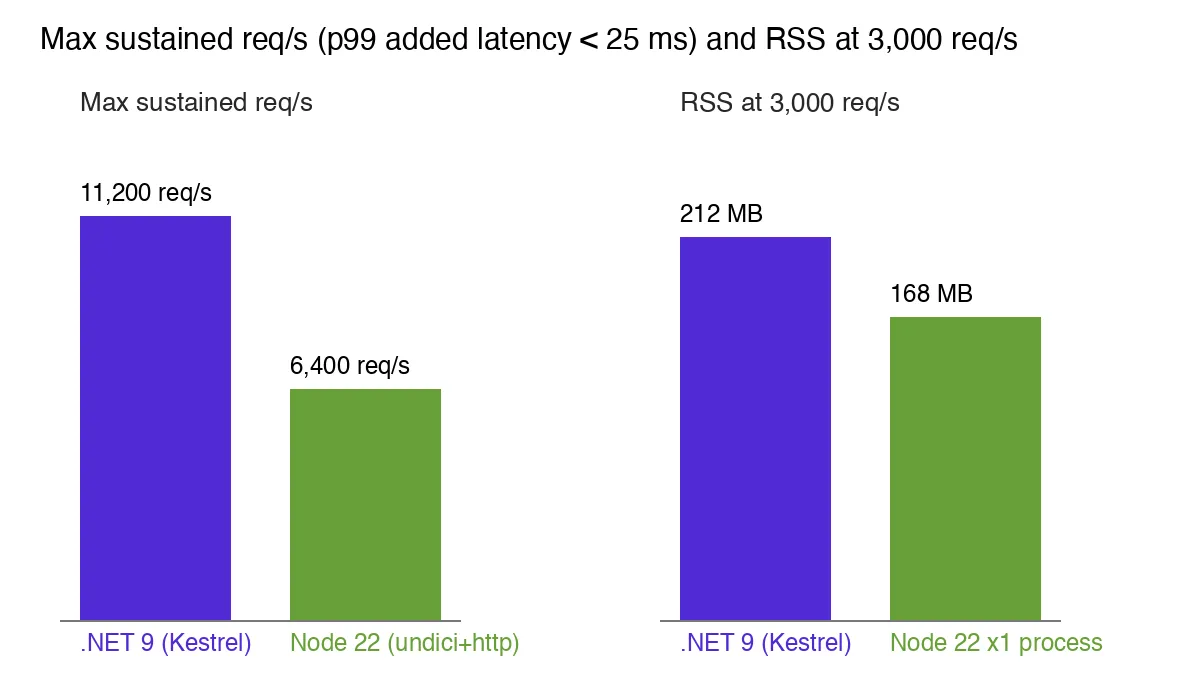 Left: the highest offered rate at which p99 added latency stayed below 25 ms on 4 vCPU. Right: RSS after 10 minutes at 3,000 req/s. Node’s four-worker cluster is not shown on the right because it is four processes (4 x 158 MB = 632 MB).
| Offered rate | .NET p99 | .NET RSS | Node x1 p99 | Node x1 RSS | Node x4 p99 | Node x4 RSS (total) |
|---|---|---|---|---|---|---|
| 1,000 req/s | 3.2 ms | 176 MB | 5.1 ms | 121 MB | 4.4 ms | 498 MB |
| 3,000 req/s | 6.8 ms | 212 MB | 14.9 ms | 168 MB | 9.7 ms | 632 MB |
| 6,000 req/s | 12.4 ms | 263 MB | - (saturated at 3,100) | - | 24.8 ms | 741 MB |
| Max under 25 ms p99 | 11,200 req/s | 318 MB | 3,100 req/s | 171 MB | 6,400 req/s | 790 MB |
Three things worth noting:
- A single Node process has a lower floor than .NET - 168 MB vs 212 MB at 3,000 req/s. The CLR’s baseline (JIT, tiered compilation buffers, a 64 MB gen0 budget on a 4-core container) is simply larger than V8’s.
- The moment you need more than one core, the picture flips. Node’s cluster is four full runtimes; .NET’s thread pool uses four cores inside one. At 6,000 req/s .NET uses a third of the memory of the Node cluster and has half the p99.
- .NET’s ceiling is 1.75x Node’s clustered ceiling on the same 4 vCPU. For a fleet sized at 6,000 req/s with headroom, that is 2 .NET pods versus 4 Node pods per region. On D4s_v5 list price that is about $280 a month per region, which is small; the bigger difference is one fewer
HorizontalPodAutoscalerevent during a traffic spike before the tail passes 25 ms.
We also tried DOTNET_GCgen0size=0x4000000 (64 MB) and Server GC. Server GC lifted RSS to 341 MB at 3,000 req/s and improved p99.9 by 1.4 ms; not worth it at this scale. For Node, --max-semi-space-size=64 reduced scavenge frequency and took p99 from 14.9 ms to 13.1 ms, the only tuning flag that measurably helped.
What Node did better
- Time to working build: Node 2 days, .NET 3. Most of the .NET delta was getting
IAsyncEnumerablestreaming to flush per chunk through Kestrel’s response pipe (HttpResponse.BodyWriter.FlushAsyncafter every event, and disabling response buffering in the test proxy). - SSE ergonomics: the Node
for await (const chunk of upstream.body)loop is the obvious shape for this problem. The .NET version needsPipeReaderto hit the same allocation profile, and the naiveStreamReader.ReadLineAsyncversion was 30% slower. - Cold start: 180 ms vs 640 ms to first successful request from container start, which matters if your gateway scales to zero on Container Apps. ReadyToRun brought .NET to 310 ms; Native AOT was not tried because the JWKS library used reflection.
- Image size: 142 MB (
node:22-alpine) vs 221 MB (mcr.microsoft.com/dotnet/aspnet:9.0-alpine).
Decision
If your gateway runs on a single core per replica and you scale horizontally anyway - a Container Apps or Lambda-style deployment - Node’s lower floor and faster cold start make it the cheaper runtime, and its p99 of 15 ms against a 286 ms time-to-first-token is noise to the end user. If you give each replica more than one core, .NET uses them without multiplying the runtime, keeps p99 under 7 ms at 3,000 req/s, and reaches a ceiling the Node cluster does not.
We kept the Node gateway for the per-tenant isolated tier, where each tenant gets a small single-core replica, and moved the shared multi-tenant tier to .NET. The numbers, not the language, decided both.
Related
- Go vs Rust for a GC-Sensitive AI Inference Gateway - the same gateway workload in the two languages platform teams usually reach for, with the GC-pause analysis.
- Go vs Node.js JSON API Throughput - Node’s event loop against Go’s scheduler on a plain JSON API, where the single-thread ceiling shows up the same way.
- Java Virtual Threads vs .NET async Throughput - how .NET’s thread pool compares on a pure I/O-bound service.
- gRPC Server-Streaming vs REST Long-Polling Latency on .NET 8 - the streaming-shape question that sits behind the SSE choice here.