Why This Jekyll Blog Took 8 Seconds to Build: 278 Git Subprocesses in One Plugin Hook
Profiling a 139-post Jekyll build: a last-modified plugin forks git twice per post and costs half of an 8 s build. One batched git log cuts it to 3.3 s.
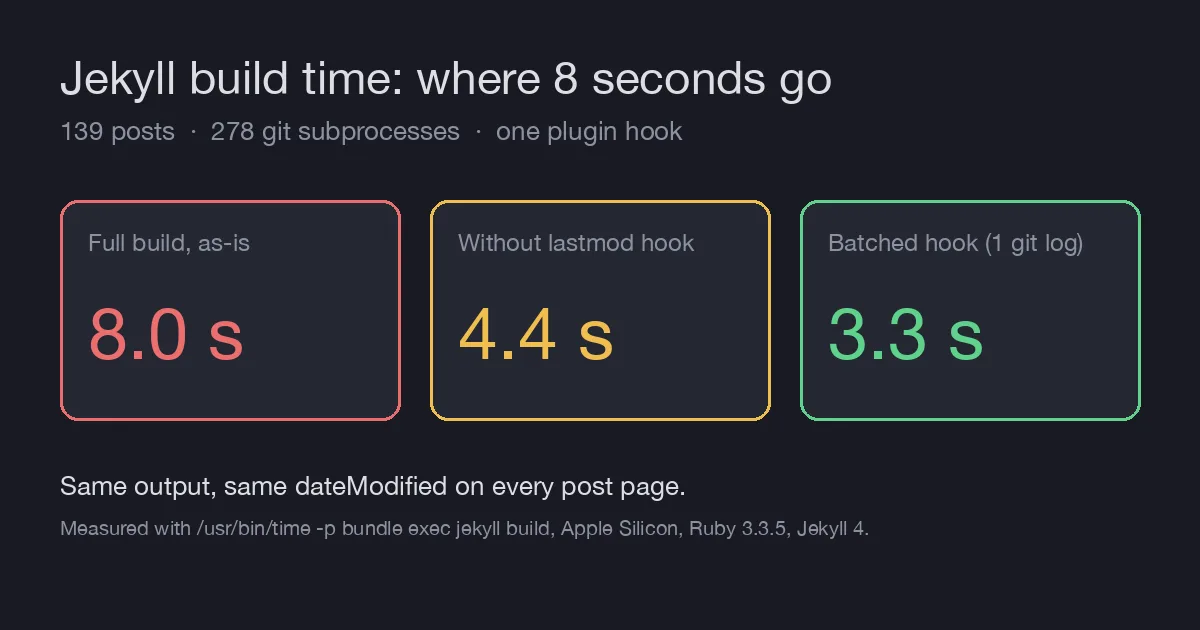
Most Performance posts here measure other systems: the Go vs Rust inference gateway, cache layers, vector databases. This one measures the blog’s own build, because an eight-second bundle exec jekyll build for 139 Markdown posts felt wrong, and the number showed up on every run of the test script and every preview while writing a post.
The usual suspects for a slow Jekyll build are Liquid-heavy layouts, Sass, and the feed. All three are in the profile below and together they do not explain the time. What does is a 14-line plugin that nobody had looked at since it was added.
Measuring the baseline
Everything here is wall-clock time for a full clean build on an Apple Silicon laptop with Ruby 3.3.5 and Jekyll 4, taken three times with /usr/bin/time -p. Jekyll’s own startup (bundle exec jekyll --version) is 0.27 s, so the rest is the build.
1
2
3
4
for i in 1 2 3; do /usr/bin/time -p bundle exec jekyll build -q 2>&1 | grep real; done
# real 8.83
# real 7.43
# real 7.70
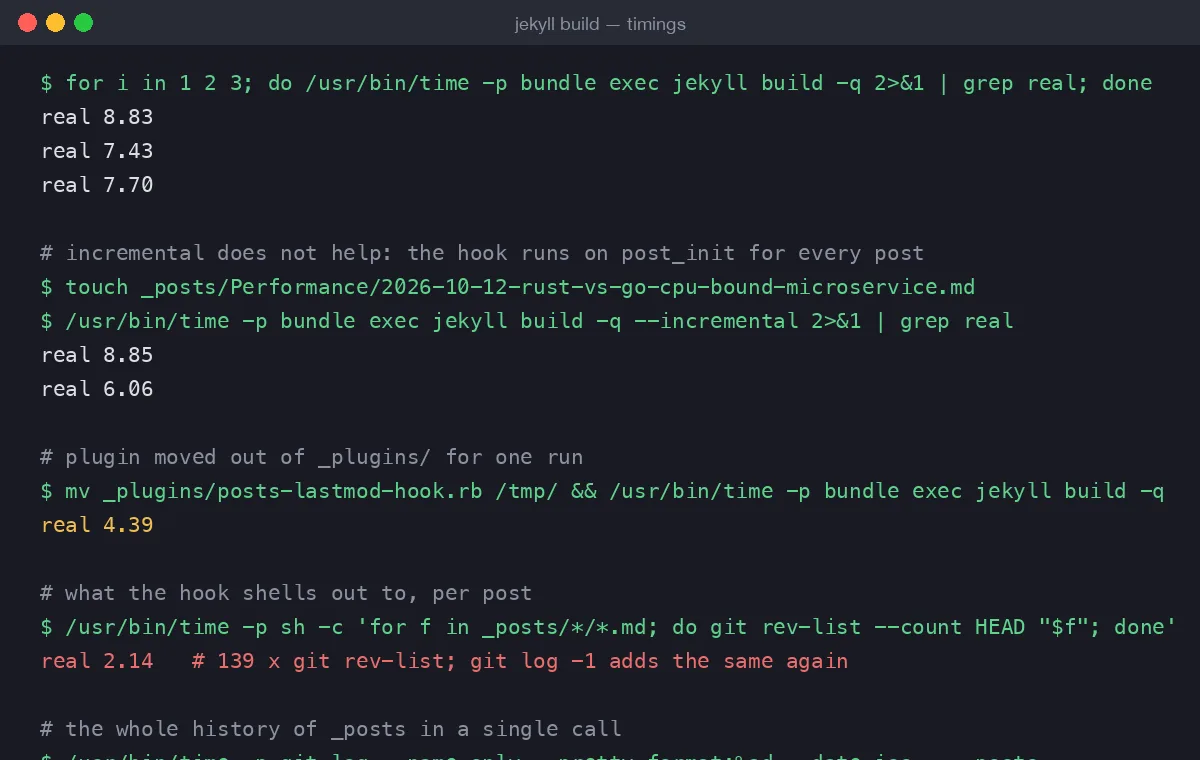
The first thing people reach for is --incremental. It did nothing useful here: touching one post and rebuilding still took 6 to 9 seconds. That was the first clue, because incremental builds skip rendering for unchanged files but still initialise every post, so whatever was slow was happening at initialisation, not at render time.
Reading the profile
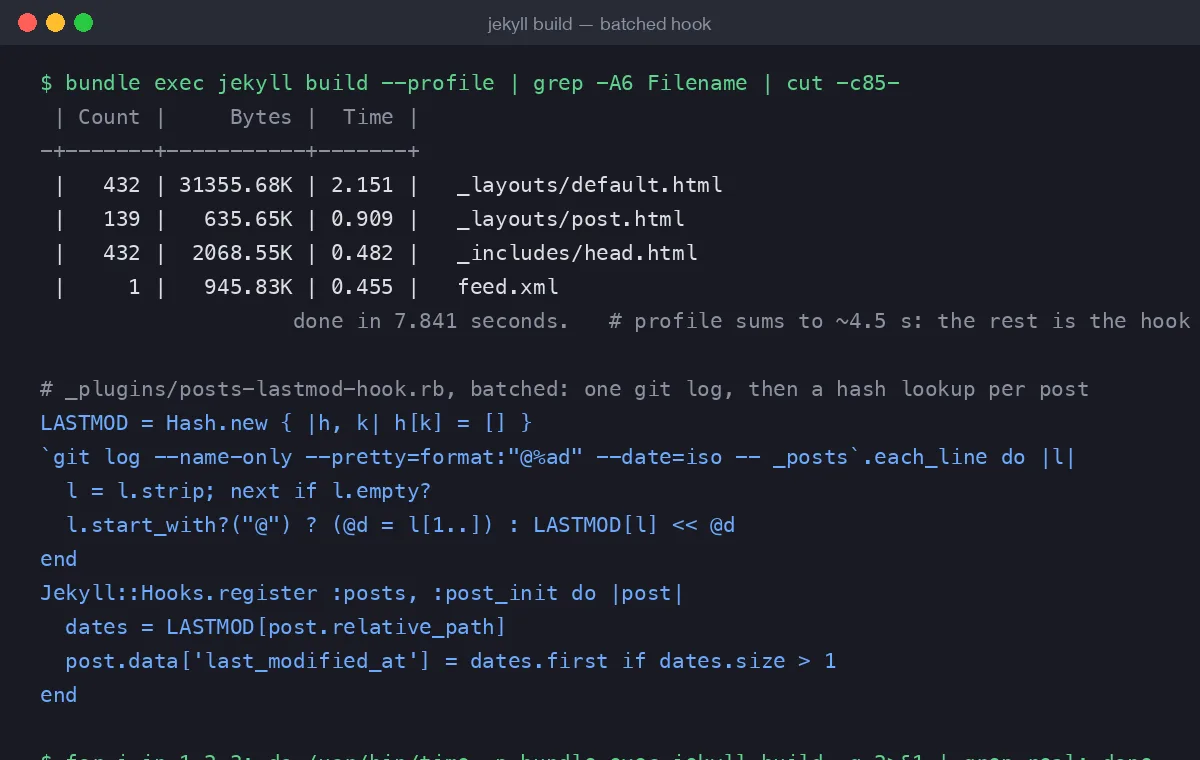
bundle exec jekyll build --profile prints per-template render times. The top four rows:
| Template | Count | Time |
|---|---|---|
_layouts/default.html | 432 | 2.15 s |
_layouts/post.html | 139 | 0.91 s |
_includes/head.html | 432 | 0.48 s |
feed.xml | 1 | 0.46 s |
The whole profile table sums to roughly 4.5 s, but the build reports done in 7.841 seconds. The profiler only times Liquid rendering, so about 3.5 s was being spent somewhere it could not see. Plugins run in that blind spot.
The plugin
The site has one custom plugin, _plugins/posts-lastmod-hook.rb. It sets last_modified_at on posts that have more than one commit, which Chirpy renders as the “Updated” date and as dateModified in the JSON-LD. It is a sensible feature. This is the implementation:
1
2
3
4
5
6
7
Jekyll::Hooks.register :posts, :post_init do |post|
  commit_num = `git rev-list --count HEAD "#{ post.path }"`
  if commit_num.to_i > 1
    lastmod_date = `git log -1 --pretty="%ad" --date=iso "#{ post.path }"`
    post.data['last_modified_at'] = lastmod_date
  end
end
Two backtick calls per post. With 139 posts that is 139 git rev-list processes and, for every post with more than one commit (all 139 here, since each has been touched at least once after creation), 139 more git log -1 processes. Each one forks, loads git, walks the history for that one path and exits. The history walk is the expensive part: git rev-list --count HEAD <path> has to visit every commit and check whether that path changed.
Confirming it the blunt way, by moving the plugin out of _plugins/ for one build:
1
2
mv _plugins/posts-lastmod-hook.rb /tmp/ && /usr/bin/time -p bundle exec jekyll build -q
# real 4.39
Half the build. And the 139 rev-list calls alone, outside Jekyll, take 2.14 s; the git log -1 calls cost about the same again.
One subprocess instead of 278
Git can answer the question for every post at once. git log --name-only over the _posts directory emits each commit’s date followed by the files it touched, newest first. Parsing that into a hash keyed by path gives every post’s commit count and most recent date in one 40-millisecond call:
1
2
/usr/bin/time -p git log --name-only --pretty=format:%ad --date=iso -- _posts
# real 0.04
The hook then becomes a lookup:
1
2
3
4
5
6
7
8
9
10
11
LASTMOD = Hash.new { |h, k| h[k] = [] }
`git log --name-only --pretty=format:"@%ad" --date=iso -- _posts`.each_line do |l|
  l = l.strip
  next if l.empty?
  l.start_with?("@") ? (@d = l[1..]) : LASTMOD[l] << @d
end

Jekyll::Hooks.register :posts, :post_init do |post|
  dates = LASTMOD[post.relative_path]
  post.data['last_modified_at'] = dates.first if dates.size > 1
end
The @ prefix on the date line is just a marker so the parser can tell a date from a filename. dates.first is the newest commit because git log lists newest first, and dates.size > 1 is the same “more than one commit” rule as before.
1
2
3
4
for i in 1 2 3; do /usr/bin/time -p bundle exec jekyll build -q 2>&1 | grep real; done
# real 4.51
# real 3.25
# real 3.22
The build went from 7.4 to 8.8 s to 3.2 to 4.5 s, and the output is the same: dateModified on a spot-checked post page is 2026-10-12T02:30:00+02:00 before and after. Two notes on correctness. A renamed post keeps its new path in git log --name-only only from the rename commit onward, which is the same behaviour the original rev-list on the current path had. And a post with exactly one commit still gets no last_modified_at, so a freshly published post shows no “Updated” badge, which is what readers expect.
What this is worth
Three to four seconds per build is not dramatic on its own. It compounds: the site’s test script builds once, every local preview builds once, and GitHub Pages builds on every push. More to the point, the 4.4 s floor with the plugin removed says the remaining time is Liquid rendering of 432 pages, which the profile does see and which can be attacked separately. The lesson is the one every profiling post ends up with: the profiler’s blind spot is where the time hides, and anything that forks a process per item in a loop is the first place to look.
This is the same shape as the pgvector vs Qdrant finding where per-query connection setup dominated the measured latency, and the HybridCache post where the network round trip, not the lookup, set the floor. Batch the round trips and the real cost shows up.
Decision
- Do: replace the per-post
gitcalls in_plugins/posts-lastmod-hook.rbwith onegit log --name-only -- _postsparsed at load time. Same output, builds in under half the time. - Keep: the “more than one commit” rule for showing an updated date, so new posts are not marked as updated.
- Next: profile the 2.15 s in
_layouts/default.html, which is rendered 432 times and is now the largest single line.