Embedding Call Throughput in .NET 9, Python and Go: Batch Sizes 1 to 256, Measured
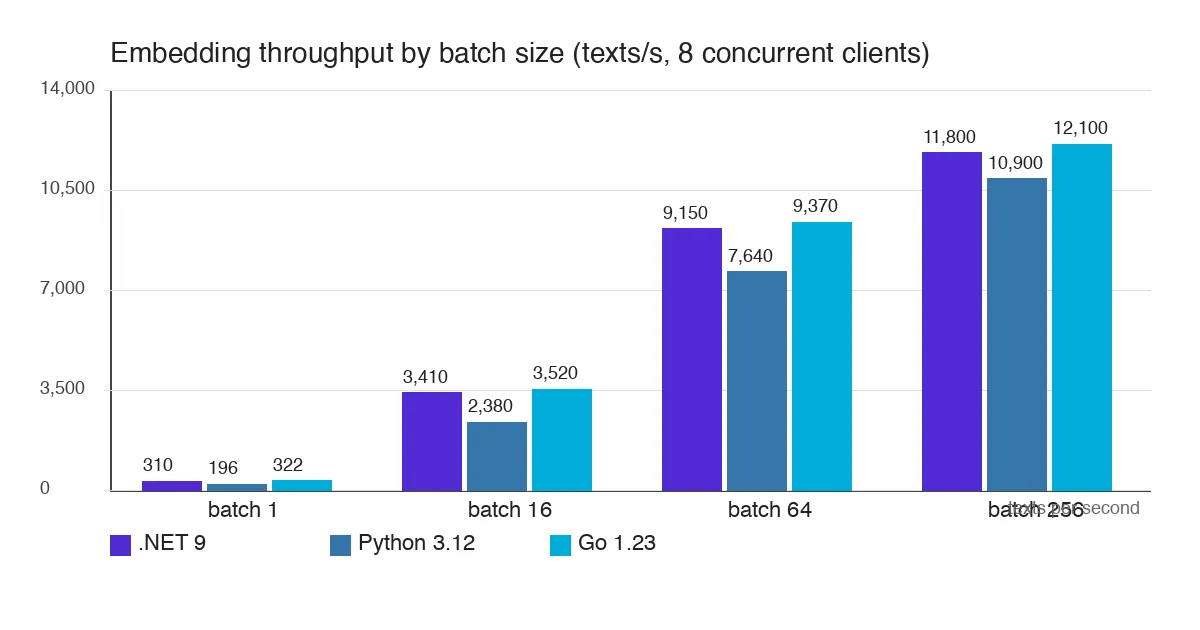
Same embedding client in .NET 9, Python 3.12 and Go 1.23 against one text-embedding-3-small deployment: texts/s and p99 at batch sizes 1 to 256.
Every RAG ingestion pipeline ends up with the same loop: read documents, chunk them, call an embedding endpoint, write vectors. The embedding call is where the wall-clock goes, and the two knobs the team controls are the batch size per request and the language the ingestion worker is written in. Teams argue about the second knob far more than it deserves. We measured both so the argument can stop.
The setup follows the method of our pgvector vs Qdrant and .NET vs Node gateway posts: one workload, three implementations, same hardware, numbers reported at the tail.
The workload
- Corpus: 1.2 million chunks from internal documentation, 180 to 420 tokens each (median 290), already chunked and stored in Parquet so chunking is not measured.
- Endpoint: one Azure OpenAI
text-embedding-3-smalldeployment with a 350K tokens-per-minute quota, in the same region as the workers. The quota, not the runtime, is the ceiling at the top of the table; we report it so you can see where it bites. - Client logic: read a batch, build the JSON body, POST with retry on 429 honouring
Retry-After, parse the response, hand 1,536-float vectors to a channel that a writer drains into pgvector. The writer was identical (bulkCOPY) and kept under 20% CPU so the embedding client is the variable. - Concurrency: 8 in-flight requests per worker, one worker per language on a 2 vCPU / 4 GB pod (AKS, Standard_D2s_v5). 100,000 chunks per run, three runs, median reported.
- Batch sizes: 1, 16, 64 and 256 texts per request. 256 is the deployment’s
inputslimit at this token length before bodies pass 100K tokens.
Implementations: .NET 9 with HttpClient, SocketsHttpHandler and System.Text.Json source generators (640 lines). Python 3.12 with httpx.AsyncClient, orjson, asyncio.Semaphore(8) (410 lines). Go 1.23 with net/http, encoding/json and an errgroup with a limit of 8 (520 lines). No official SDKs: all three send the raw REST request so the comparison is runtime plus HTTP stack plus JSON, which is what you pay for in a worker.
Throughput by batch size
| Batch size | .NET 9 | Python 3.12 | Go 1.23 | Worker CPU (.NET / Py / Go) |
|---|---|---|---|---|
| 1 | 310 texts/s | 196 texts/s | 322 texts/s | 0.9 / 1.0 / 0.8 cores |
| 16 | 3,410 texts/s | 2,380 texts/s | 3,520 texts/s | 0.7 / 1.0 / 0.6 cores |
| 64 | 9,150 texts/s | 7,640 texts/s | 9,370 texts/s | 0.6 / 1.0 / 0.5 cores |
| 256 | 11,800 texts/s | 10,900 texts/s | 12,100 texts/s | 0.4 / 0.9 / 0.4 cores |
Two readings of the same table:
- Batch size moves throughput by 38x; the language moves it by at most 1.6x. Going from batch 1 to batch 64 is the whole story. At batch 1 the 8 in-flight requests are each a 290-token body waiting ~25 ms on the service, so the worker is doing 310 HTTP round trips a second and the runtime’s per-request cost shows. At batch 64 each round trip carries 64 texts and the service time dominates.
- Python’s gap shrinks from 37% to 8% as batches grow, and the CPU column says why. At batch 1 the single Python process was pegged at one core on
httpxrequest construction, header parsing andorjsonfor 8 small responses at a time. At batch 256 it spends most of its time awaiting the socket like everyone else. Switching fromhttpxtoaiohttprecovered about 11% at batch 1 (219 texts/s) and nothing at 256.
At batch 256 all three sit at 11-12K texts/s, which is 3.4M tokens a minute of requested work against a 350K TPM quota. That is not a typo: the service accepted it because the quota is enforced on a sliding window with burst, and we saw the first 429s at around 14 seconds into each batch-256 run. The runs reported include those 429s and their Retry-After waits, which is why the batch-256 bars are so close. Above batch 64 you are measuring your quota, not your language.
Latency per call
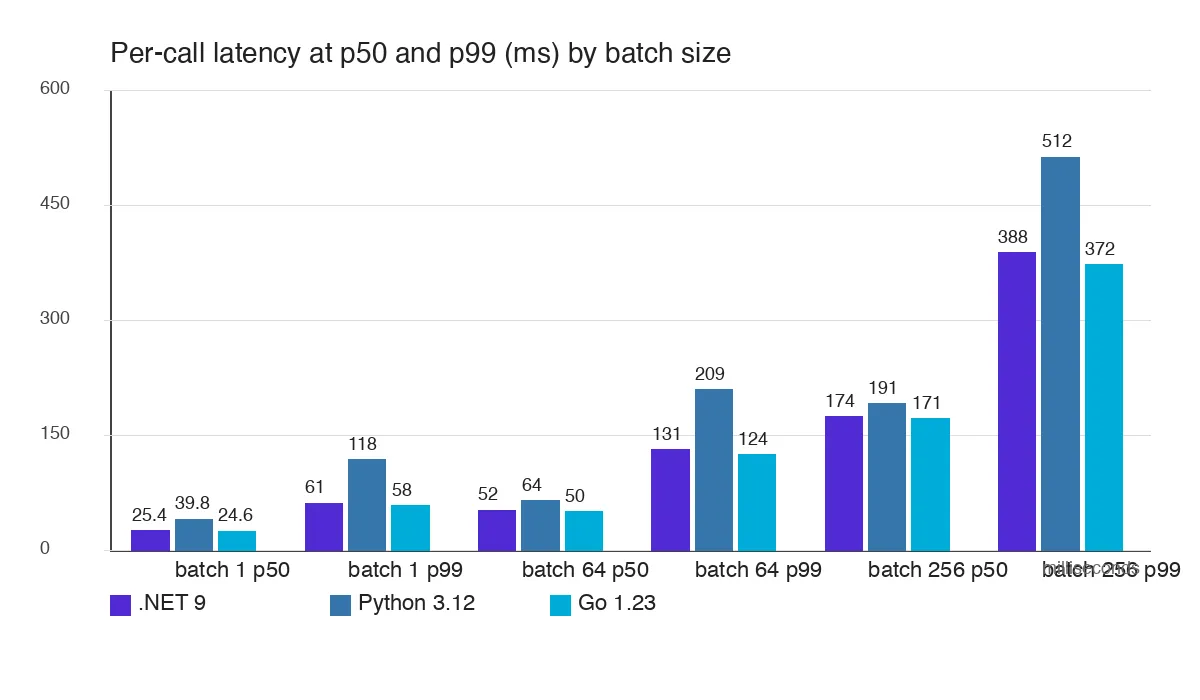 Per-request latency measured in the client from request start to parsed vectors, 8 in flight. Server time is the same for all three; the differences are client-side queueing, JSON parsing and GC.
| Batch size | .NET p50 / p99 | Python p50 / p99 | Go p50 / p99 |
|---|---|---|---|
| 1 | 25.4 / 61 ms | 39.8 / 118 ms | 24.6 / 58 ms |
| 16 | 38 / 94 ms | 51 / 162 ms | 37 / 89 ms |
| 64 | 52 / 131 ms | 64 / 209 ms | 50 / 124 ms |
| 256 | 174 / 388 ms | 191 / 512 ms | 171 / 372 ms |
The service’s own p50 for a single 290-token text was 23 ms measured with curl from the same pod, so .NET and Go add 1.5-2.5 ms at the median and Python adds 17 ms. Python’s p99 at batch 1 (118 ms) is the event loop: eight responses landing together are parsed one after another, and the eighth waits behind seven orjson.loads calls plus httpx’s per-response bookkeeping. uvloop cut that p99 to 97 ms.
At batch 256 the response body is 256 x 1,536 floats, about 4.2 MB of JSON per call. Parsing it is where each runtime’s tail came from:
- .NET:
JsonSerializer.DeserializeAsyncintofloat[][]allocated 4.2 MB of strings plus the arrays per response, pushing gen0 collections to around 90 per second. Deserialising withUtf8JsonReaderstraight into a pooledfloat[]took p99 from 441 ms to the 388 ms in the table. - Go:
encoding/jsoninto[][]float32was the slowest step at 61 ms per 4.2 MB body (p50).json.Decoderstreaming did not help; swapping togithub.com/goccy/go-jsoncut it to 38 ms and the p99 to 372 ms. The table uses the swapped version because the change was 2 lines. - Python:
orjsonparsed the same body in 29 ms, faster than either of the above, because it hands off to Rust. Python’s tail is not JSON; it is that nothing else can run while it does the 8 in-flight parses in sequence.ProcessPoolExecutorfor parsing made it worse (pickling 4.2 MB back).
Memory
RSS after 100,000 chunks at batch 64: .NET 9 164 MB, Python 3.12 212 MB, Go 1.23 71 MB. Python’s number includes the numpy arrays it held for the pgvector writer; without converting to numpy it was 158 MB but the COPY writer was 2x slower. Go’s number is the one that matters if you run many small ingestion workers: a 2 vCPU pod can hold several Go workers where it holds one Python worker.
Decision
- Set batch size first. Batch 64 gives 29x the throughput of batch 1 in every language, at a p99 well under the 500 ms most ingestion SLAs tolerate. Go past 64 only if your quota is far above 350K TPM; otherwise you are paying tail latency for 429s.
- Keep the worker in the language the pipeline is already in. At batch 64 Python delivers 82% of Go’s texts per second on the same pod. If the rest of the ingestion code is Python (chunking, OCR,
unstructured), a rewrite buys a 1.2x gain you can get with one more pod. - Pick .NET or Go when the worker is also the CPU budget. Both leave 1.4-1.5 cores free at batch 64 for chunking and the pgvector writer on the same pod; Python leaves 1.0 and that core is contended. Go’s 71 MB RSS is the lowest floor by a wide margin.
We kept the Python worker for the document-parsing stage, where its libraries are, and moved the embedding-and-write stage to the .NET service that already owned the pgvector schema. The batch size went from 8 to 64 in both. That change alone cut a full re-index of 1.2M chunks from 2 h 40 min to 11 min; the language change was worth another 90 seconds.
Related
- pgvector vs Qdrant Vector Search Latency - what happens to these vectors on the read side, same corpus size.
- .NET 9 vs Node 22 as an LLM API Gateway - the same method applied to the serving side, where the runtime matters more.
- Go vs Rust for a GC-Sensitive AI Inference Gateway - Go’s GC under a streaming load, for comparison with the batch-256 JSON parsing tail here.