pgvector vs Qdrant: Vector Search Latency on 1M Embeddings, Measured at p99
Same 1M OpenAI embeddings, same recall floor. pgvector IVFFlat p99 61 ms, pgvector HNSW 18.4 ms, Qdrant 9.7 ms; the filter case decides it.
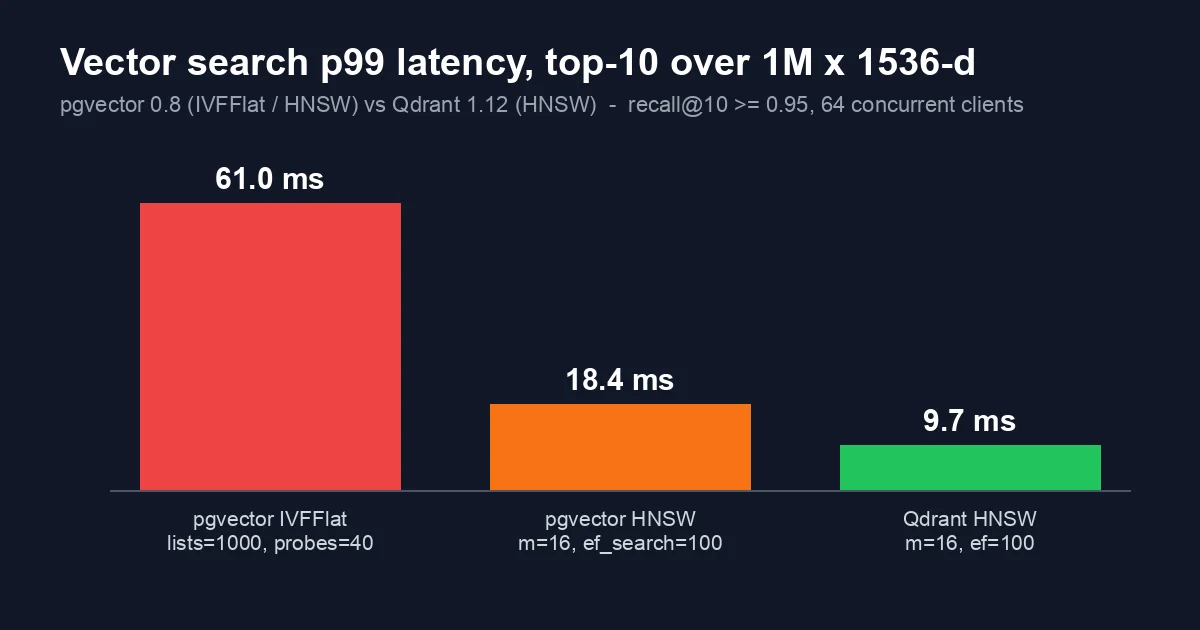
Every RAG service we have shipped eventually hits the same question in a design review: “we already run PostgreSQL, can we just use pgvector, or do we need a dedicated vector database?” The usual answer is a shrug and a link to a vendor benchmark. This post is the measurement I wanted to have in that meeting: the same corpus, the same queries, the same recall floor, and the one query shape (a tenant filter) that most enterprise copilots actually run.
Three candidates: pgvector 0.8 on PostgreSQL 16 with an IVFFlat index, the same pgvector with an HNSW index, and Qdrant 1.12 with its native HNSW index. The embeddings are the ones from the Azure OpenAI embeddings post: text-embedding-3-small, 1536 dimensions, cosine distance.
The setup
- 1,000,000 chunks of internal documentation, each with a
tenant_id(200 tenants, skewed so the largest holds 6%) and a 1536-d embedding. - 10,000 held-out query embeddings with exact (brute-force) top-10 neighbours precomputed once, so every run reports
recall@10against the truth rather than against itself. - Both databases on the same machine: Hetzner AX52 (Ryzen 7 7700, 64 GB, NVMe), Docker, one container at a time. PostgreSQL got
shared_buffers=16GB,maintenance_work_mem=8GB; Qdrant got default settings with the collection kept in RAM. - Load generator: a small Go program (
vecbench) with 64 concurrent clients for 60 s, three runs, the middle run reported. Latencies are measured client side, so network, driver and serialization are included, which is what a service sees. - Index parameters were tuned until each candidate cleared recall@10 >= 0.95. Comparing latency at different recall is the most common way vector benchmarks lie, so this floor is the rule for the whole post.
Index build times, since they matter for the first deploy and every reindex:
| Index | Parameters | Build time | Size on disk |
|---|---|---|---|
| pgvector IVFFlat | lists = 1000 | 4 min 10 s | 6.1 GB |
| pgvector HNSW | m = 16, ef_construction = 128 | 38 min | 7.9 GB |
| Qdrant HNSW | m = 16, ef_construct = 128 | 21 min | 7.2 GB (incl. payload) |
The IVFFlat build is fast because it is k-means plus a bucket assignment. HNSW on pgvector is single-threaded for most of its build in 0.8 (parallel build helps the first phase only), which is where the 38 minutes come from. Qdrant builds segments in parallel.
Unfiltered top-10
| Candidate | Tuning for recall >= 0.95 | recall@10 | QPS | p50 | p95 | p99 |
|---|---|---|---|---|---|---|
| pgvector IVFFlat | probes = 40 | 0.951 | 902 | 38.2 ms | 52.9 ms | 61.0 ms |
| pgvector HNSW | ef_search = 100 | 0.978 | 4,365 | 11.6 ms | 15.8 ms | 18.4 ms |
| Qdrant HNSW | ef = 100 | 0.981 | 8,608 | 5.9 ms | 8.3 ms | 9.7 ms |
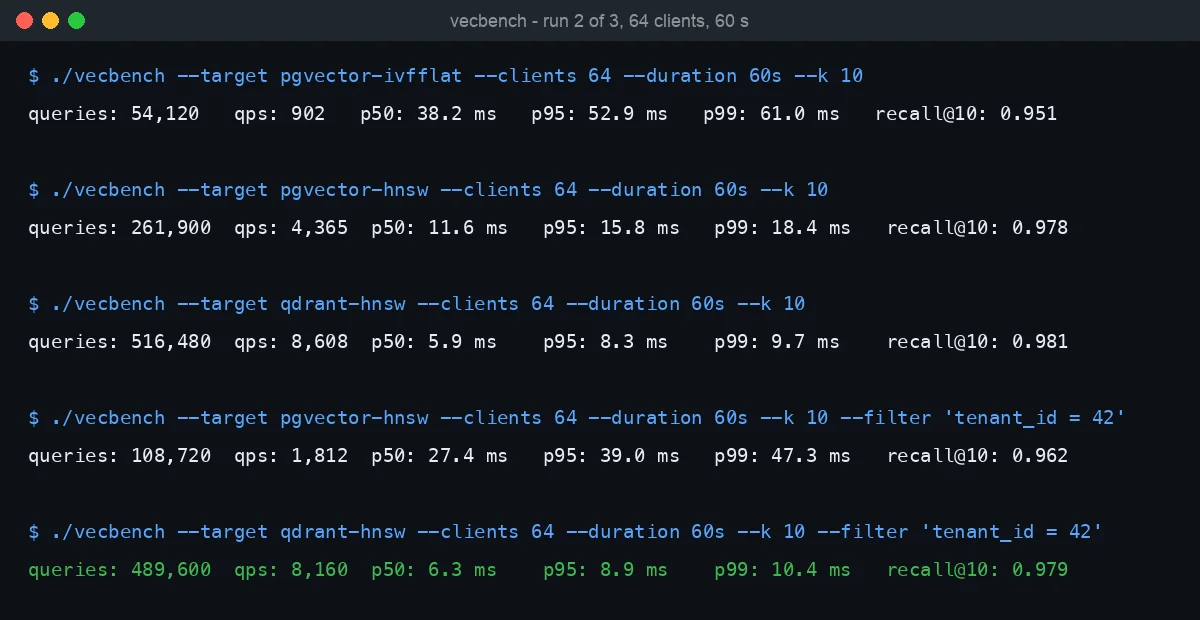
Three things in that table:
- IVFFlat at 0.95 recall is slow. To reach the floor it has to scan 40 of 1,000 lists, which is 4% of the corpus, about 40,000 full 1536-d distance computations per query. The index is cheap to build and that is where its advantages end at this size.
- pgvector HNSW is a real contender. 18.4 ms p99 at 4,365 QPS from a single PostgreSQL instance is well inside what a chat-style RAG endpoint needs, where the LLM call behind the retrieval takes 1-3 s anyway.
- Qdrant is about 2x faster than pgvector HNSW on the same graph parameters. The gap is mostly not the graph; it is the surrounding work. PostgreSQL goes through the planner, the executor, buffer manager and the row-at-a-time index scan, then returns tuples through the wire protocol. Qdrant’s query path is a purpose-built loop over in-memory segments with SIMD distance kernels. Running
EXPLAIN (ANALYZE, BUFFERS)on the pgvector query shows ~2,100 shared buffer hits per query, each one a lock and a pin.
The query real services run: filtered by tenant
Almost no enterprise retrieval is “nearest 10 in the whole corpus”. It is “nearest 10 that this user is allowed to see”. So the second benchmark adds WHERE tenant_id = 42 (a tenant holding ~0.5% of rows, 5,000 chunks) to every query.
| Candidate | recall@10 | QPS | p50 | p95 | p99 |
|---|---|---|---|---|---|
pgvector HNSW, ef_search = 100 | 0.71 | 4,290 | 11.8 ms | 16.0 ms | 18.9 ms |
pgvector HNSW, ef_search = 400 | 0.962 | 1,812 | 27.4 ms | 39.0 ms | 47.3 ms |
| pgvector HNSW + partitioned by tenant | 0.994 | 6,120 | 8.1 ms | 11.2 ms | 13.6 ms |
Qdrant HNSW, payload index on tenant_id | 0.979 | 8,160 | 6.3 ms | 8.9 ms | 10.4 ms |
This is the table that should decide the design review.
With the default ef_search = 100, pgvector’s recall collapsed to 0.71. The reason is post-filtering: the HNSW scan returns its candidate set first, then PostgreSQL applies the WHERE, and when only 0.5% of candidates match, most of the 100 are thrown away and the query returns fewer than 10 rows or the wrong 10. (pgvector 0.8 added iterative scans, hnsw.iterative_scan = relaxed_order, which fixes the “fewer than 10 rows” problem by continuing the scan; it brought recall to 0.93 in our run at the cost of p99 going to 31 ms. The table shows the simpler knob.)
Raising ef_search to 400 restores recall but costs 2.5x in p99 and more than halves throughput, because every query now walks a much larger part of the graph only to discard 99.5% of what it finds.
Partitioning the table by tenant_id and building one HNSW index per partition fixes it properly: the filter becomes partition pruning, each graph is 200x smaller, and p99 drops below the unfiltered number. The costs are operational: 200 indexes, a reindex story per partition, and it only works for a filter column you know in advance.
Qdrant barely moved (9.7 to 10.4 ms) because its HNSW implementation does filtering during the graph traversal using the payload index, and it builds extra graph links for low-cardinality payload values so that a filtered search does not fragment. That is the single capability that justifies a separate vector database in our experience, and it is worth far more than the 2x on the unfiltered case.
Where the time goes, from the Postgres side
1
2
3
4
5
6
7
8
SET hnsw.ef_search = 100;
EXPLAIN (ANALYZE, BUFFERS)
SELECT id FROM chunks
ORDER BY embedding <=> $1
LIMIT 10;
-- Index Scan using chunks_embedding_hnsw on chunks (actual time=9.84..9.91 rows=10)
--   Buffers: shared hit=2113
-- Execution Time: 10.02 ms
About 10 ms of the 11.6 ms p50 is inside the index scan, and almost all of that is the ~2,100 page visits: each HNSW hop lands on a different 8 KB page holding one or a few vectors, since a 1536-d vector is 6 KB and does not fit several to a page. Halving the dimension (the Azure embeddings API accepts dimensions: 768 for text-embedding-3-small) cut buffer hits to ~1,150 and p99 to 11.9 ms at recall 0.969, which is the cheapest pgvector speed-up available and one most teams never try.
What I would actually recommend
- Under ~1M vectors, single tenant or coarse filters, already running PostgreSQL: pgvector HNSW. 18 ms p99 is invisible behind an LLM call, you keep one database, one backup, one set of permissions, and the retrieval query can
JOINthe document metadata in the same statement. Skip IVFFlat unless the build time is the thing you cannot afford. - Strict per-user or per-tenant filtering with high selectivity: either partition pgvector by that column, or move to Qdrant (or another engine with filtered HNSW). Do not ship the
ef_search = 100default with a selective filter; measure recall against a brute-force truth set first, because the latency numbers will look fine while the answers are quietly wrong. - Beyond a few million vectors, or many different filter columns: a dedicated engine. The graph build alone becomes a scheduled job on pgvector, and every filter you did not partition on pays the ef_search tax.
As with the Prisma vs Drizzle post, the benchmark is less interesting than the shape of the failure: the vector database did not win on raw speed by a margin that matters, it won on not degrading under the one query the product actually runs.
Related
- Azure OpenAI Embeddings for Semantic Search in .NET - where the 1536-d vectors in this benchmark come from, and the brute-force baseline we started with.
- Evaluating a RAG Retriever with a Golden Set in .NET - how to build the truth set that makes recall@10 measurable.
- pg vs Prisma vs Drizzle: PostgreSQL Driver Latency from Node.js 22 - the same PostgreSQL 16 box without the vector index, for a sense of the floor.