Enterprise AI: A Cost Observability Dashboard for Azure OpenAI with Log Analytics, KQL and Workbooks
Turn Azure OpenAI diagnostic logs into a per-team, per-model daily cost dashboard with KQL and an Azure Monitor Workbook, plus a budget alert.
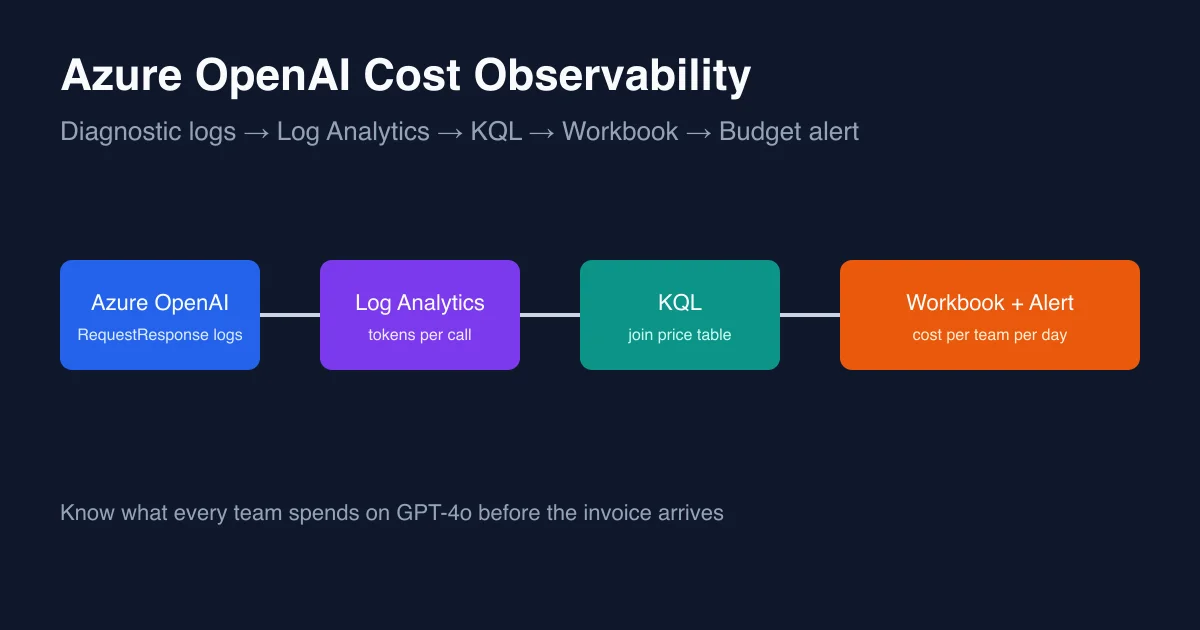
Azure Cost Management tells you what the Azure OpenAI resource cost last month. It cannot tell you which team spent it, which model ate most of it, or that Thursday’s spike was one batch job re-indexing a document library for the third time. Those answers live in the token counts, and token counts live in the diagnostic logs you probably have not turned on yet. This post builds a cost observability dashboard from those logs: a KQL query that prices every call, an Azure Monitor Workbook that shows cost per team per day, and an alert that pages the platform team when a team blows through its daily budget.
Why the invoice is too late
Azure OpenAI bills per 1,000 tokens, split into input and output at different prices per model. The invoice arrives as one line per deployment, weeks after the spend. By then:
- the batch job that burned $600 in an afternoon has run six more times;
- Finance wants a split by team and you only have a split by region;
- nobody can say whether moving the FAQ bot to
gpt-4o-miniactually saved anything.
If you already put APIM in front of Azure OpenAI, the gateway emits per-subscription token metrics and this gets easier. But plenty of enterprises are not there yet, and the diagnostic logs of the Azure OpenAI resource itself are enough to start.
Step 1: Turn on the diagnostic setting
On the Azure OpenAI resource open Diagnostic settings → Add diagnostic setting, tick Request and Response Logs (RequestResponse) and Audit (Audit) and send them to a Log Analytics workspace. The Bicep equivalent, so it survives the next environment:
1
2
3
4
5
6
7
8
9
10
11
12
13
resource diag 'Microsoft.Insights/diagnosticSettings@2021-05-01-preview' = {
  name: 'aoai-to-law'
  scope: openAi
  properties: {
    workspaceId: logAnalytics.id
    logs: [
      { categoryGroup: 'allLogs', enabled: true }
    ]
    metrics: [
      { category: 'AllMetrics', enabled: true }
    ]
  }
}
Within a few minutes the AzureDiagnostics table starts receiving rows with OperationName, DurationMs, properties_s (a JSON blob with the model deployment name) and, crucially, properties_s fields for prompt and completion tokens. Note that the request and response bodies are not logged; only metadata and token counts. That matters for the privacy review.
Step 2: Tag every call with a team
Tokens are useless for chargeback without an owner. Two ways to get one into the log:
- Caller identity. If clients use managed identity (which the governance post argued they should),
CallerIPAddressand theproperties_s.objectIdfield identify the app registration. Keep a small lookup table that maps object IDs to teams. - A header. Ask every client to send
x-ms-client-request-idin the formteam/app/correlation-id. It is echoed back in the log asproperties_s.clientRequestId. In .NET this is one line:
1
2
3
4
var options = new ChatCompletionOptions();
// Azure.AI.OpenAI 2.x: set the client request id through the pipeline
client.Pipeline.CreateMessage().Request.Headers.Set(
    "x-ms-client-request-id", $"support-assistant/faq-bot/{Activity.Current?.TraceId}");
The lookup table is a Log Analytics custom table or, simpler, a datatable inlined in the query. The same goes for prices: a datatable with per-model input and output price per 1,000 tokens, updated when Microsoft changes the list.
Step 3: The KQL query that prices every call
let Prices = datatable(Model:string, InputPer1k:real, OutputPer1k:real)
[
    "gpt-4o",                  0.0025, 0.0100,
    "gpt-4o-mini",             0.00015, 0.0006,
    "text-embedding-3-large",  0.00013, 0.0
];
let Teams = datatable(Prefix:string, Team:string)
[
    "support-assistant", "support-assistant",
    "eng-runbooks",      "eng-runbooks",
    "hr-copilot",        "hr-copilot"
];
AzureDiagnostics
| where ResourceProvider == "MICROSOFT.COGNITIVESERVICES"
| where Category == "RequestResponse"
| extend props = parse_json(properties_s)
| extend Model = tostring(props.modelDeploymentName),
         PromptTokens = toint(props.promptTokens),
         CompletionTokens = toint(props.completionTokens),
         Prefix = tostring(split(props.clientRequestId, "/")[0])
| lookup kind=leftouter Prices on Model
| lookup kind=leftouter Teams on Prefix
| extend Team = coalesce(Team, "unattributed")
| extend CostUsd = PromptTokens / 1000.0 * InputPer1k
                 + CompletionTokens / 1000.0 * OutputPer1k
| summarize Tokens = sum(PromptTokens + CompletionTokens),
            CostUsd = round(sum(CostUsd), 2)
          by Team, Model, Day = bin(TimeGenerated, 1d)
| order by Day desc, CostUsd desc
Three things worth noticing:
unattributedis a first-class row. The first week it will be the biggest team. That is the point: it is the list of clients that have not adopted the header yet, and it shrinks visibly as teams comply.- Prices are in the query, not in a secret spreadsheet. When the price list changes, the change is a pull request with a reviewer.
- Embeddings have zero output price. Forgetting that overstates embedding cost by a surprising amount, because embedding jobs move far more tokens than chat.
Step 4: The workbook
Create an Azure Monitor Workbook, add a query step with the KQL above and render it as a stacked bar chart by Team over Day. Add a second step that drops the Team grouping and renders a grid by Model. Pin a text step at the top with the month-to-date total against the budget so the first thing anyone sees is the number Finance asked for.
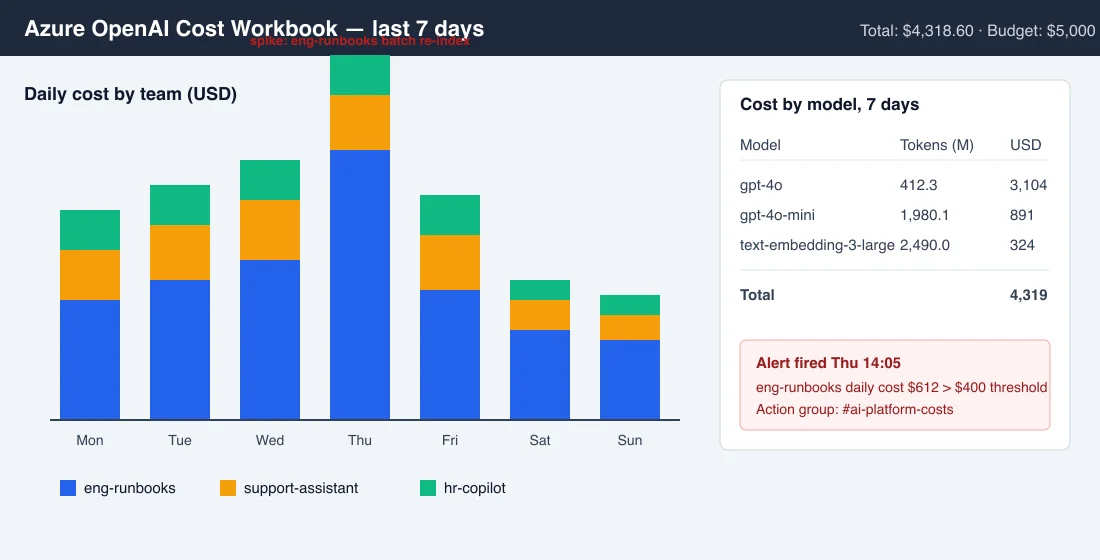
The spike on Thursday is the whole reason to build this. In the invoice it would have been $600 smeared across a month. Here it is a bar, labelled with the team, visible the same day, and traceable (through clientRequestId) to the one job that caused it.
Step 5: The alert that beats the invoice
A dashboard only helps if somebody looks at it. Add a log search alert rule on the workspace with a shorter version of the query:
AzureDiagnostics
| where ResourceProvider == "MICROSOFT.COGNITIVESERVICES" and Category == "RequestResponse"
| where TimeGenerated > startofday(now())
| extend props = parse_json(properties_s)
| extend Model = tostring(props.modelDeploymentName),
         Team = tostring(split(props.clientRequestId, "/")[0])
| lookup kind=leftouter Prices on Model
| extend CostUsd = toint(props.promptTokens) / 1000.0 * InputPer1k
                 + toint(props.completionTokens) / 1000.0 * OutputPer1k
| summarize CostToday = sum(CostUsd) by Team
| where CostToday > 400
Evaluate it every 15 minutes, fire when the result has at least one row, and route it to an action group that posts in the platform team’s channel. The threshold is per team and deliberately boring; the goal is not to stop the job but to make sure a human knows about it before the second run.
What changed for the users
- Finance gets a per-team daily cost table they can export, replacing a month-end argument.
- Teams see their own spend the same day and can compare
gpt-4oagainstgpt-4o-minifor the same workload with real numbers rather than list prices. - The platform team stops discovering runaway jobs on the invoice.
Once the unattributed row is near zero, the next step is to move the quota enforcement into APIM so the alert becomes a 429 instead of a chat message. The dashboard stays: the gateway tells you who was throttled, the dashboard tells you what everything cost.