Enterprise AI: LLM Observability with OpenTelemetry in .NET - Tracing Tokens, Cost and Quality per Request
How to instrument Azure OpenAI calls in .NET with OpenTelemetry so every request carries tokens, cost, latency and a quality score per tenant.
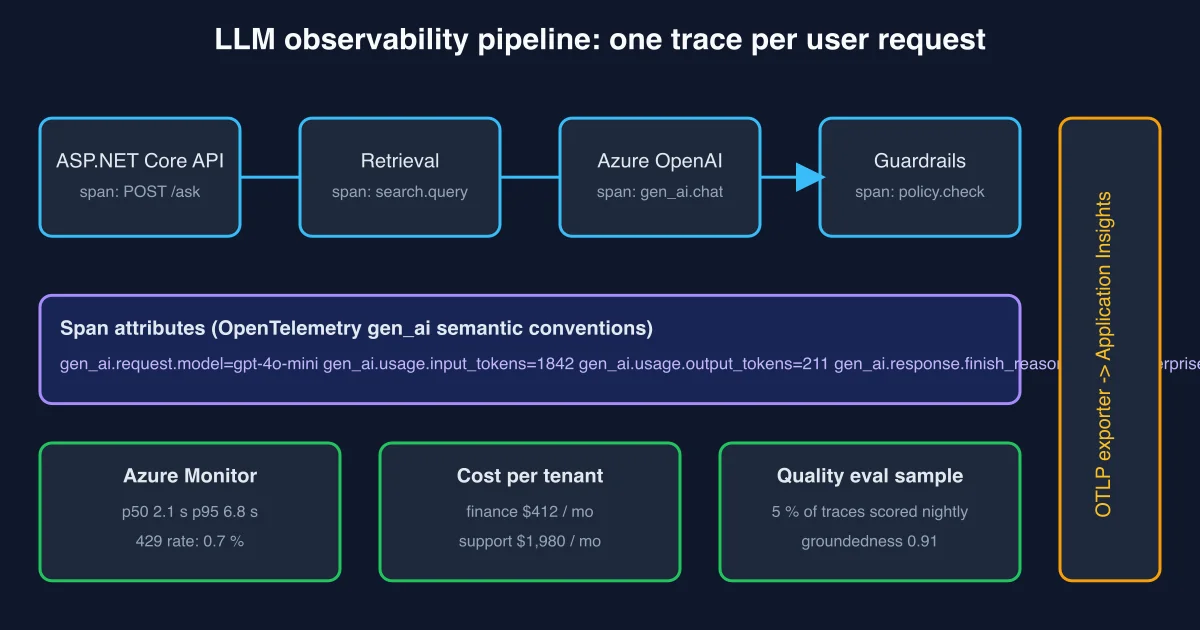
Most enterprise LLM features ship with exactly one metric: the Azure bill at the end of the month. When finance asks “why did AI spend double in September?” or a user says “the copilot got slower this week”, nobody can answer because the only trace is an HTTP 200 from /ask. This post shows how to make every LLM request observable like any other dependency: one OpenTelemetry trace per user request, with spans for retrieval, the model call and guardrails, carrying token counts, cost and tenant as attributes, exported to Azure Monitor.
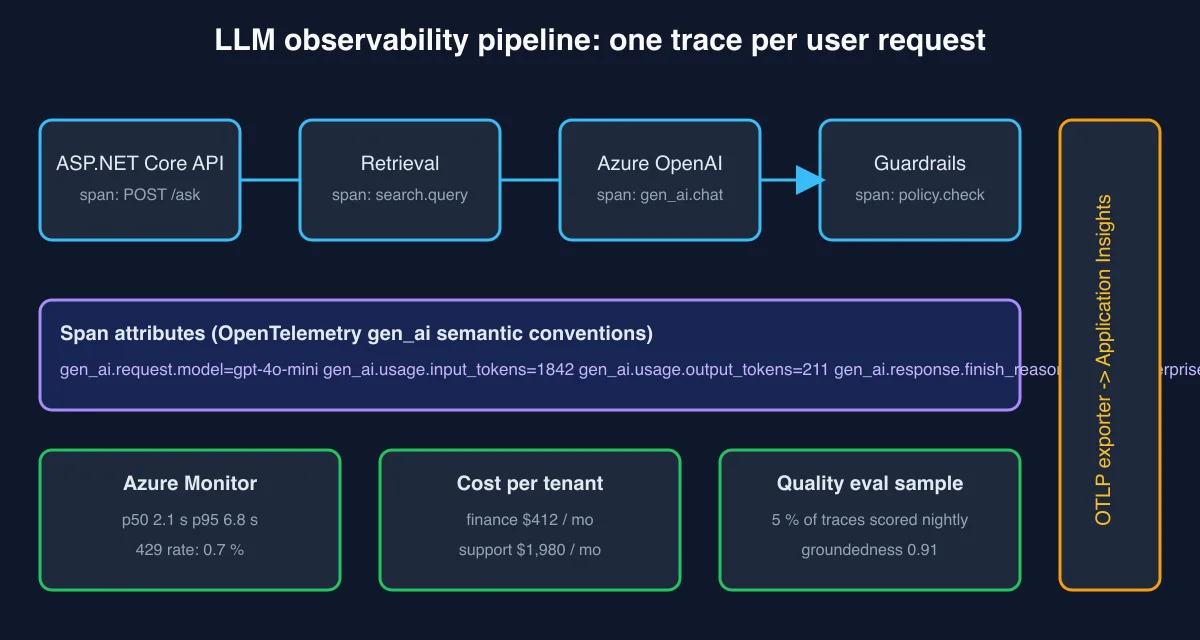
What you want on every trace
Before writing code, agree on the questions the trace must answer. In the reviews I have done these five cover almost everything:
| Question | Attribute(s) |
|---|---|
| Which model and deployment served this? | gen_ai.request.model, gen_ai.system |
| How many tokens went in and out? | gen_ai.usage.input_tokens, gen_ai.usage.output_tokens |
| What did it cost and who pays? | enterprise.cost_usd, enterprise.tenant |
| Why did it stop? | gen_ai.response.finish_reasons (stop, length, content_filter) |
| Was the answer any good? | enterprise.eval.groundedness (sampled, added later) |
The gen_ai.* names come from the OpenTelemetry Generative AI semantic conventions. Using them instead of home-grown names means Azure Monitor, Grafana and Datadog dashboards built by other teams work on your data too.
Step 1: Add OpenTelemetry to the API
1
2
3
4
5
6
7
8
9
10
11
builder.Services.AddOpenTelemetry()
    .ConfigureResource(r => r.AddService("internal-copilot-api"))
    .WithTracing(t => t
        .AddAspNetCoreInstrumentation()
        .AddHttpClientInstrumentation()
        .AddSource("Copilot.Llm")          // our custom ActivitySource
        .AddAzureMonitorTraceExporter(o =>
            o.ConnectionString = builder.Configuration["AppInsights:ConnectionString"]))
    .WithMetrics(m => m
        .AddMeter("Copilot.Llm")
        .AddAzureMonitorMetricExporter());
AddHttpClientInstrumentation() already gives you a span for the raw HTTPS call to *.openai.azure.com, including the 429s. What it cannot see is tokens and cost, because those live in the response body. That is what the custom ActivitySource is for.
Step 2: Wrap the Azure OpenAI call
1
2
3
4
5
6
7
8
9
10
11
12
13
14
15
16
17
18
19
20
21
22
23
24
25
26
27
28
29
30
31
32
33
34
35
36
public sealed class TracedChatClient(ChatClient inner, IPricing pricing)
{
    private static readonly ActivitySource Source = new("Copilot.Llm");
    private static readonly Meter Meter = new("Copilot.Llm");
    private static readonly Counter<long> Tokens =
        Meter.CreateCounter<long>("gen_ai.client.token.usage");
    private static readonly Histogram<double> Cost =
        Meter.CreateHistogram<double>("enterprise.llm.cost_usd");

    public async Task<ChatCompletion> CompleteAsync(
        IList<ChatMessage> messages, string tenant, CancellationToken ct)
    {
        using var activity = Source.StartActivity("gen_ai.chat", ActivityKind.Client);
        activity?.SetTag("gen_ai.system", "azure.openai");
        activity?.SetTag("gen_ai.request.model", inner.Model);
        activity?.SetTag("enterprise.tenant", tenant);

        var sw = Stopwatch.StartNew();
        ChatCompletion result = await inner.CompleteChatAsync(messages, cancellationToken: ct);
        sw.Stop();

        var usage = result.Usage;
        var cost = pricing.Estimate(inner.Model, usage.InputTokenCount, usage.OutputTokenCount);

        activity?.SetTag("gen_ai.usage.input_tokens", usage.InputTokenCount);
        activity?.SetTag("gen_ai.usage.output_tokens", usage.OutputTokenCount);
        activity?.SetTag("gen_ai.response.finish_reasons", result.FinishReason.ToString());
        activity?.SetTag("enterprise.cost_usd", cost);

        var tags = new TagList { { "model", inner.Model }, { "tenant", tenant } };
        Tokens.Add(usage.InputTokenCount, tags.With("direction", "input"));
        Tokens.Add(usage.OutputTokenCount, tags.With("direction", "output"));
        Cost.Record(cost, tags);
        return result;
    }
}
Two decisions worth calling out:
- Cost is computed in code, not derived later. Pricing changes per model and region; a small
IPricingtable in config that you update when Microsoft changes prices is far simpler than reverse-engineering the bill. - Never put the prompt or completion text in a span attribute by default. They contain customer data and blow past Application Insights’ 8 KB attribute limit. Store a content hash and a sampled copy in a locked-down store if you need replay.
Step 3: Retrieval and guardrails get their own spans
If you use RAG (see the RAG vs fine-tuning post), wrap the search call in a search.query span with search.top_k, search.hits and search.filter (the permission filter). Wrap content safety or policy checks in policy.check with policy.verdict. Now a slow request decomposes immediately: in the pipeline above, a 6.8 s p95 turned out to be 4.9 s in retrieval because the index had no permission filter pushed down, not the model at all.
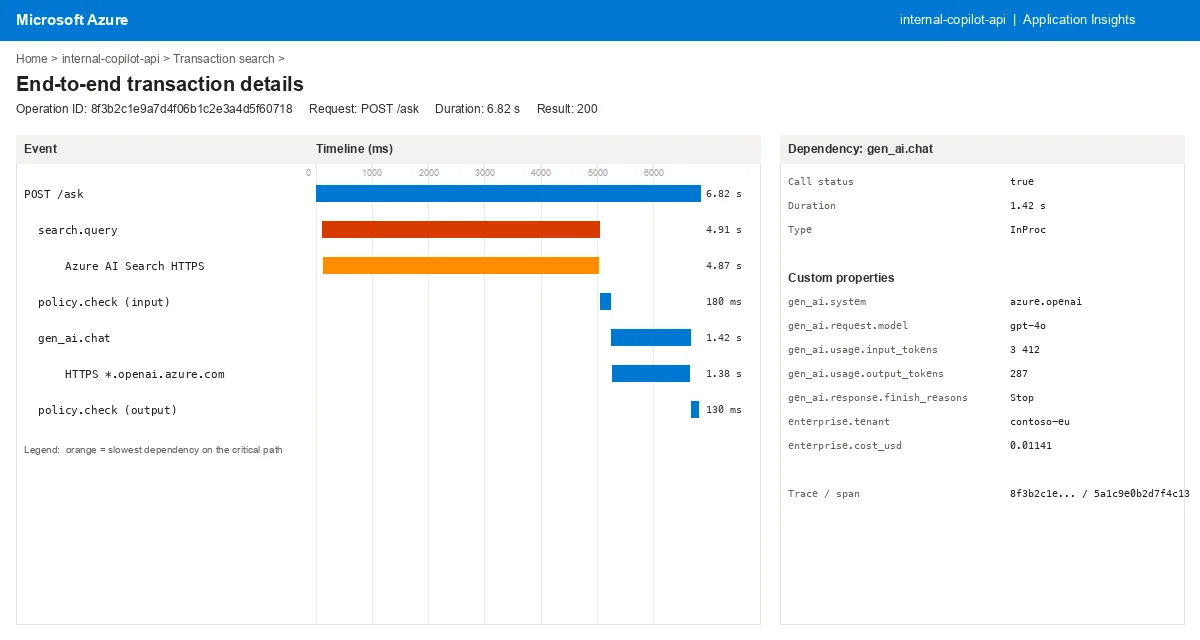
This is what that request looks like in the Application Insights End-to-end transaction details blade: the orange search.query span dominates the waterfall, and clicking gen_ai.chat shows the gen_ai.* and enterprise.* attributes from Step 2 as custom properties, so cost and tenant are visible on the same screen as latency.
Step 4: Sample quality, do not score everything
Scoring every answer with a judge model doubles your token spend. Instead, a nightly job pulls 5 % of traces from Application Insights by operation_Id, re-hydrates prompt and answer from the sampled store, scores groundedness and relevance, and writes the score back as a custom event joined on the same operation_Id. The dashboard shows quality next to latency and cost for the same requests, which is what you need when someone proposes switching to a cheaper model.
Queries that pay for themselves
Cost per tenant for the month (KQL):
dependencies
| where name == "gen_ai.chat" and timestamp > startofmonth(now())
| extend tenant = tostring(customDimensions["enterprise.tenant"]),
         cost = todouble(customDimensions["enterprise.cost_usd"])
| summarize total_usd = sum(cost), requests = count() by tenant
| order by total_usd desc
Requests truncated by the model (a silent quality bug):
dependencies
| where name == "gen_ai.chat"
| where customDimensions["gen_ai.response.finish_reasons"] == "Length"
| summarize count() by bin(timestamp, 1d), tostring(customDimensions["gen_ai.request.model"])
Checklist
- One trace per user request, with
gen_ai.chat,search.queryandpolicy.checkchild spans. - Standard
gen_ai.*attribute names; cost and tenant asenterprise.*. - Token and cost metrics (not just spans) so dashboards survive trace sampling.
- Prompt text out of attributes; hashes in, sampled copies in a restricted store.
- Quality scored on a sample and joined by
operation_Id.
With this in place, “why did AI spend double?” becomes a 30-second query, and “the copilot is slow” becomes a span waterfall instead of a guess. See the companion posts on handling 429s and token counting and cost for the pieces this builds on.