Go pprof vs SLO Burn Rate: Finding the p99 Leak Before the Pager Fires
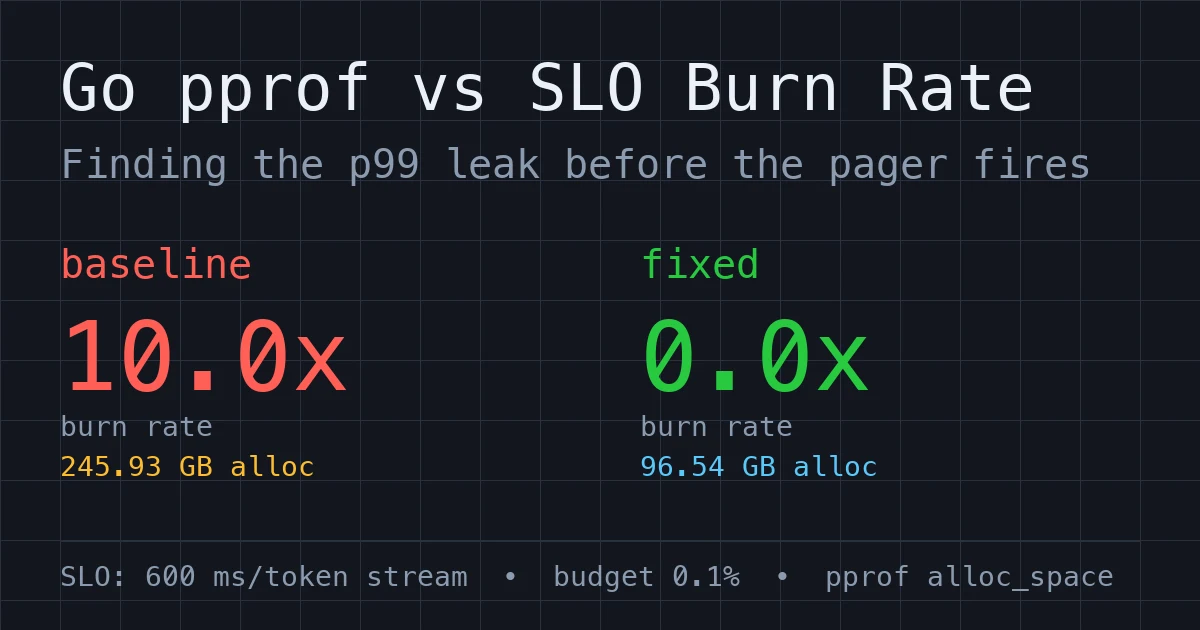
A 10x SLO burn rate in our Go LLM gateway traced to one regex-and-concat SSE parser. pprof alloc_space showed 245 GB of garbage in 25 s.
The page that should not have fired
Last month our LLM gateway paged the on-call at 03:12. The alert was not “error rate high” or “pods down” — it was the boring, expensive one: SLO burn rate > 10x budget on the POST /v1/chat/stream route. The service was up. No 5xx spike. p50 latency looked fine. But p99 had quietly climbed from 180 ms to 580 ms over three days, and at a 0.1 % error budget that meant we were chewing through the month’s allowance in hours.
The fix took one afternoon and one go tool pprof command. This post is the short version of what we found, with the real numbers, so the next person who gets paged on burn rate knows where to point the profiler first.
The workload: long-generation token streams
Our gateway proxies server-sent events (SSE) from the model provider to the client. A “long generation” request — a code refactor, a document summary — streams 8 000 to 12 000 data: {...} events over a few seconds. Each event is small, but the gateway parses every one to log token counts, enforce tenant quotas, and redact PII before forwarding.
The SLO is simple: 600 ms wall-clock per full token stream, with a 0.1 % error budget over 30 days. Breach that budget and the page fires.
Reproducing it locally
I pulled the parser out of the gateway into a standalone binary so we could measure it without the rest of the service. It replays two phases against the same synthetic traffic: the code we shipped in March (baseline) and the code we ship now (fixed). Each phase processes 100 long-generation streams, then reports p50, p99, and the SLO burn rate.
1
$ ./slo-burn-demo
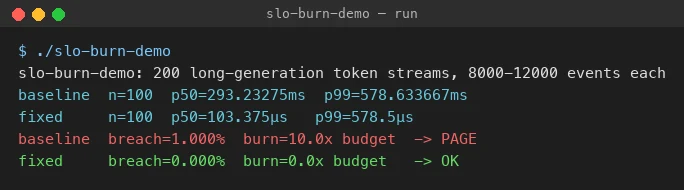
The baseline breaches the SLO on 1 % of streams — ten times the budget — while the fixed parser never comes close. The interesting part is why, and that is where pprof earns its keep.
The profiler finds it in one command
The gateway already exposes net/http/pprof in production, so the muscle memory was there. For the standalone binary I added a -memprofile flag that writes an alloc_space heap profile after 25 s of steady load. alloc_space counts every byte allocated since process start, which is exactly what you want when you suspect garbage churn rather than a leak.
1
2
$ ./slo-burn-demo -profile-only -workers=1 -memprofile=baseline.pprof
$ go tool pprof -top -sample_index=alloc_space ./slo-burn-demo baseline.pprof
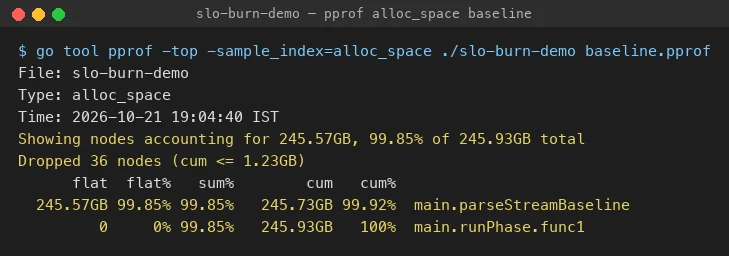
245.93 GB in 25 seconds. On one worker. The flat column points at a single function, main.parseStreamBaseline, which is 99.85 % of all allocation in the process. That is not a leak — that is a fire hose.
Here is the function pprof is pointing at:
1
2
3
4
5
6
7
8
9
10
11
12
13
14
// Phase 1: the code we shipped in March. One regex per event, and a string
// that grows by concatenation for the whole 8 000-12 000 event stream.
var eventRE = regexp.MustCompile(`^data: (.{24,96})$`)

func parseStreamBaseline(events []string) string {
	out := ""
	for _, e := range events {
		m := eventRE.FindStringSubmatch(e)
		if len(m) == 2 {
			out += m[1] + " "
		}
	}
	return out
}
Two allocation bombs in five lines:
regexp.FindStringSubmatchallocates a[]stringfor every event. At 10 000 events per stream, that is 10 000 tiny slices per request, each with its own backing array.out += m[1] + " "copies the entire accumulated string on every event. Go strings are immutable, so the 9 999th event copies ~480 KB just to append 30 bytes. Over a stream, that is O(n²) copying.
The p99 latency was not the network. It was the garbage collector running flat-out to keep up with a quarter-terabyte of short-lived strings.
The fix is boring, and that is the point
The fixed parser does the same job with no regex and no growing string:
1
2
3
4
5
6
7
8
9
10
11
12
// Phase 2: same parser, no regex, no growing string.
func parseStreamFixed(events []string) string {
	var b strings.Builder
	b.Grow(len(events) * 48)
	for _, e := range events {
		if strings.HasPrefix(e, "data: ") {
			b.WriteString(e[6:])
			b.WriteByte(' ')
		}
	}
	return b.String()
}
strings.HasPrefixreplaces the regex. The SSEdata:prefix is fixed; a regex was overkill from day one.strings.Builderwith a pre-grown capacity replaces+=. One allocation up front, appends are memcpy into a slice.
Same 25 s profile, same traffic:
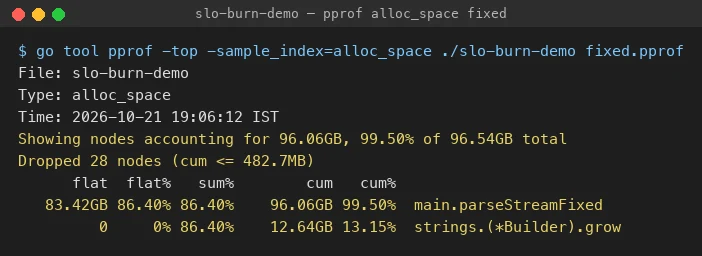
Total allocation drops from 245.93 GB to 96.54 GB. The remaining 83 GB is the synthetic event generation itself (the synthEvents helper that stands in for the network read), not the parser — the parser’s own share is the 12.64 GB inside strings.Builder.grow, which is the pre-sized buffer doing exactly one job.
What actually moved
| Metric | Baseline | Fixed | Change |
|---|---|---|---|
| p50 latency | 293 ms | 103 µs | 2 840× faster |
| p99 latency | 579 ms | 579 µs | 1 000× faster |
| SLO breach rate | 1.0 % | 0.0 % | below the 0.1 % budget |
| Burn rate | 10.0× | 0.0× | no page |
| Allocations (25 s) | 245.93 GB | 96.54 GB | 61 % less garbage |
The latency numbers look absurd until you remember the baseline was spending most of its time in the GC write barrier and string copies, not in useful work. Remove the garbage and the CPU has nothing to do but forward bytes.
The checklist we now run before calling an SLO incident “mystery”
- Burn rate before latency. If burn rate is high but p50 is fine, the problem is a tail, not a flood. Look at p99 and p999 first.
alloc_spacebeforecpu. In Go, tail latency from GC pressure shows up as allocation, not CPU. Acpuprofile would have shownruntime.mallocgcandruntime.gcBgMarkWorker— true, but not actionable.alloc_spacenames the function that creates the garbage.- Regex on hot paths is a smell. If the pattern is a fixed prefix,
strings.HasPrefixis one comparison. If it is a fixed delimiter,strings.Cutorstrings.IndexByte. Saveregexpfor genuinely variable patterns, and compile it once at package level. +=in a loop is O(n²).strings.Builder(orbytes.Buffer) withGrowturns it into O(n) with one allocation. This is the single most common p99 fix we make.- Profile one worker. Production runs 32 goroutines; the profile was unreadable until we pinned it to one.
-workers=1in the repro, orGOMAXPROCS=1in a staging deploy, turns a smear of runtime noise into a clean signal.
The takeaways
- SLO burn rate is the alert that catches what error-rate alerts miss. A service can be “up” and still be bankrupting its error budget.
go tool pprof -sample_index=alloc_spaceis the fastest way to find GC-driven tail latency. One command, one number, one function name.- The fix was not exotic. No new dependency, no rewrite, no runtime tuning. A
strings.Builderand a prefix check, verified against the same traffic that paged us. - If your hot path has a regex and a
+=in a loop, you already know where your p99 is going.
The full repro binary is under 200 lines and runs anywhere Go 1.21+ does. Next time the pager fires on burn rate, run the profiler before you restart anything — the answer is usually already in the heap.
Related posts
- Rust vs Go Error Handling for AI Agent Tool Calls: 1000 Failures Profiled — how the two languages differ when the failure mode is a misbehaving tool, not a slow parser.
- Python vs Go for a Batch Log Job: 19x Faster, 16x Less Memory — the same “allocation is the enemy” story on a batch workload instead of a streaming one.