Time-to-First-Token for Streamed LLM Responses: .NET 9 vs Node 22, Measured
Streaming LLM proxy in .NET 9 vs Node 22 at 1,500 streams: added time-to-first-token p99 46 vs 69 ms, and the two code shapes that push it past 100 ms.
Users do not experience the throughput of an LLM endpoint. They experience the pause before the first word appears. Everything after that is a stream of tokens arriving faster than they read. That pause is the model’s own time-to-first-token (TTFT) plus whatever your proxy adds, and the proxy part is the only part you control.
The earlier streaming post showed how to stream Azure OpenAI responses from .NET. The gateway throughput post measured requests per second and p99 of whole requests. Neither measured the number the user feels. This post does: the TTFT a proxy adds, in .NET 9 and Node 22, and the two implementation mistakes that dominate it.
What was measured
- Workload: HTTP/1.1 JSON in, Server-Sent Events out, 400-token prompt, 128 output tokens. The proxy validates a JWT, picks a backend pool, forwards the request, and relays each
data:event as it arrives. - Backend: a stub that behaves like a loaded vLLM deployment: 90 ms before the first token, then one token every 14 ms. The stub is on a separate node with 0.3 ms RTT.
- Metric: added TTFT = time the client saw the first
data:event minus time the stub emitted it. The stub’s 90 ms is subtracted so the numbers below are pure proxy overhead. - Hardware: one 4 vCPU / 8 GB pod per proxy (AKS, Standard_D4s_v5), load generator on its own node, 10 minutes per level after a 2 minute warm-up, three runs, median reported.
- Concurrency: 100, 500, 1,000, 1,500 and 3,000 open streams, closed loop (each virtual user opens the next stream when the previous ends).
Four variants were measured, because the first .NET build and the first Node build both had a shape problem that is more important than the runtime difference.
Results at 1,500 concurrent streams
| Variant | p50 | p99 | p99.9 |
|---|---|---|---|
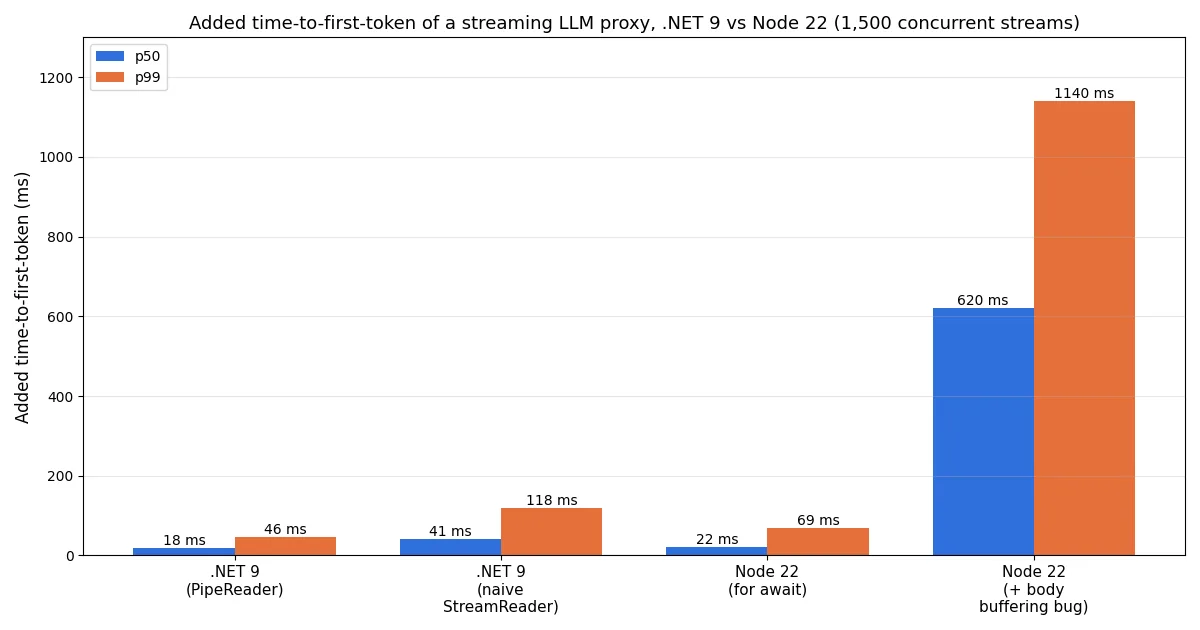
.NET 9, PipeReader + FlushAsync per event | 18 ms | 46 ms | 93 ms |
.NET 9, StreamReader.ReadLineAsync + default buffering | 41 ms | 118 ms | 240 ms |
Node 22, for await over undici body | 22 ms | 69 ms | 171 ms |
Node 22, await response.text() then split | 620 ms | 1,140 ms | 1,620 ms |
The two good variants are 4 ms apart at p50 and 23 ms apart at p99. Against a model TTFT of 300 to 900 ms, neither is visible to a user. The two bad variants are.
Why the naive .NET version loses 72 ms at p99
StreamReader.ReadLineAsync on the upstream response is fine; the cost was on the outgoing side. Kestrel buffers response writes until the buffer fills or the handler completes. The first SSE event is about 80 bytes, so it sat in the buffer until the next few tokens arrived. The fix is one line per event:
1
2
3
4
5
await foreach (var evt in upstream.ReadEventsAsync(ct))
{
    await response.BodyWriter.WriteAsync(evt.Bytes, ct);
    await response.BodyWriter.FlushAsync(ct);   // without this the first token waits for its neighbours
}
Switching the upstream read from StreamReader to PipeReader took another 9 ms off p50 by removing a string allocation and a UTF-16 round trip per event, but the flush was the fix that mattered. Also check that nothing in front of the pod buffers: the test ingress had proxy_buffering on by default and added a flat 210 ms until it was turned off for the /v1/chat/completions location.
Why the naive Node version loses half a second
await response.text() is the shape every tutorial uses for non-streaming calls, and it does the obviously wrong thing here: it waits for the entire response. Added TTFT becomes the whole generation time, 128 tokens x 14 ms = roughly 1.8 s minus what the client would have seen anyway. The p50 of 620 ms in the table is what it costs when the stub’s token cadence is faster than a real model’s.
The correct shape is the one Node makes easy:
1
2
3
4
5
6
7
const upstream = await fetch(url, { method: "POST", body, headers, dispatcher });
res.writeHead(200, { "content-type": "text/event-stream", "cache-control": "no-cache" });
res.flushHeaders();
for await (const chunk of upstream.body!) {
  res.write(chunk);           // http.ServerResponse does not buffer across writes
}
res.end();
res.flushHeaders() matters: without it, the status line and headers wait for the first res.write, which costs nothing here but means a client that times out on headers sees the model’s full TTFT before it sees a 200.
Added TTFT against concurrency
| Open streams | .NET 9 p50 | .NET 9 p99 | Node 22 p50 | Node 22 p99 | Node CPU |
|---|---|---|---|---|---|
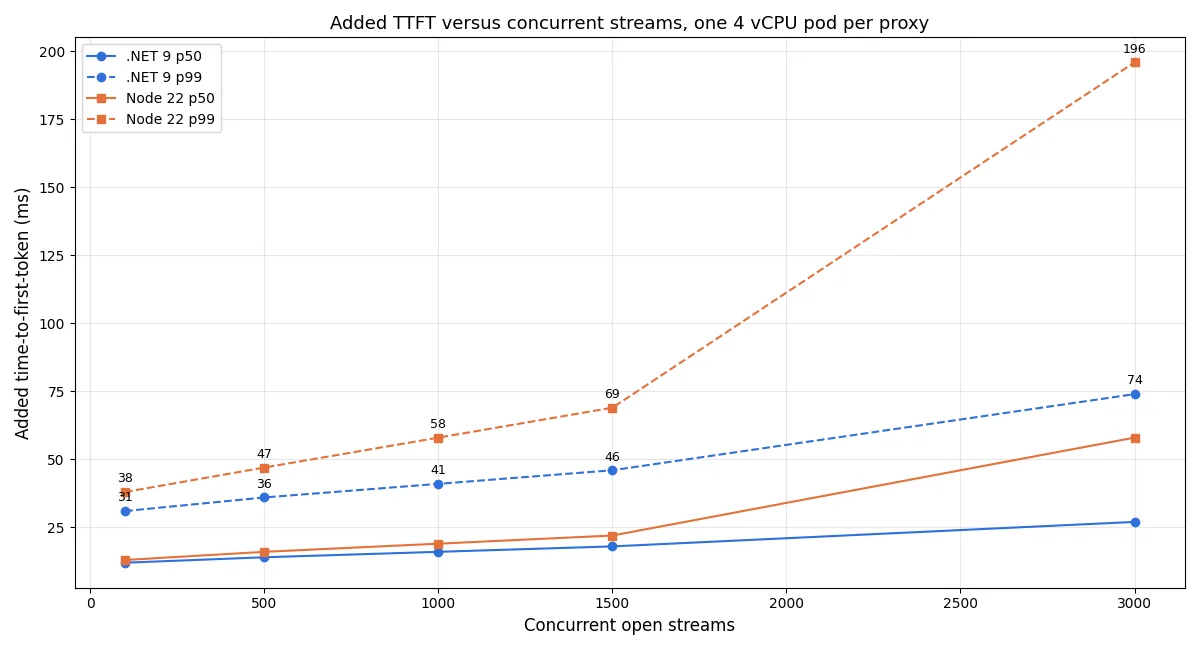
| 100 | 12 ms | 31 ms | 13 ms | 38 ms | 0.2 core |
| 500 | 14 ms | 36 ms | 16 ms | 47 ms | 0.5 core |
| 1,000 | 16 ms | 41 ms | 19 ms | 58 ms | 0.8 core |
| 1,500 | 18 ms | 46 ms | 22 ms | 69 ms | 1.0 core |
| 3,000 | 27 ms | 74 ms | 58 ms | 196 ms | 1.0 core (saturated) |
Up to about 1,000 streams the two runtimes are within 20 ms at the tail, and that gap is below what anyone will notice. Node’s curve bends at 1,500 because a single process has one core for JWT validation, JSON parsing and event relaying, and every new request’s first token queues behind the relaying of everyone else’s tokens. .NET spreads the same work over four cores. Running Node under cluster with 4 workers brought 3,000-stream p99 down to 102 ms at the cost of 4x the resident memory, the same trade-off the throughput post found.
Three things that moved TTFT more than the runtime
- Flushing per event (.NET): 118 ms to 46 ms at p99. One line.
- Not buffering the body (Node): 1,140 ms to 69 ms at p99. One shape change.
- Ingress buffering: a flat 210 ms on both, invisible in the pod’s own metrics. Measure from the client, not the pod.
Then, well below those: HTTP/2 to the upstream saved 3 ms p50 on .NET through connection reuse under load; --max-semi-space-size=64 on Node took 6 ms off p99 at 1,500 streams; Server GC on .NET changed nothing measurable for TTFT.
Decision
For a streaming proxy that will see fewer than 1,000 concurrent streams per replica, pick the runtime your team already runs; measured correctly, both add less than 60 ms at p99 to a first token that takes the model 300 ms or more. Above that, .NET’s multi-core process keeps p99 under 75 ms where a single Node process triples, and Node needs cluster and the memory that comes with it.
Either way, put a TTFT panel on the dashboard measured from a synthetic client outside the cluster. Both bad variants above shipped to a staging environment and passed every existing throughput and error-rate check; the only metric that caught them was the one users feel.
Related
- Streaming Azure OpenAI Responses in .NET - the .NET streaming code this post measures, including the
IAsyncEnumerablehandler. - .NET 9 vs Node 22 as an LLM API Gateway - throughput, whole-request p99 and memory for the same two runtimes.
- vLLM vs TGI vs TensorRT-LLM Serving Latency - the model-side TTFT that the proxy overhead here sits on top of.
- gRPC Server-Streaming vs REST Long-Polling Latency on .NET 8 - the transport choice behind SSE.