Enterprise AI: Cost and Latency SLOs for LLM Workloads - Burn-Rate Alerts for Azure OpenAI in Production
Define cost and p95 latency SLOs per team and model for Azure OpenAI, compute burn rates in KQL, and page only when both windows are on fire.
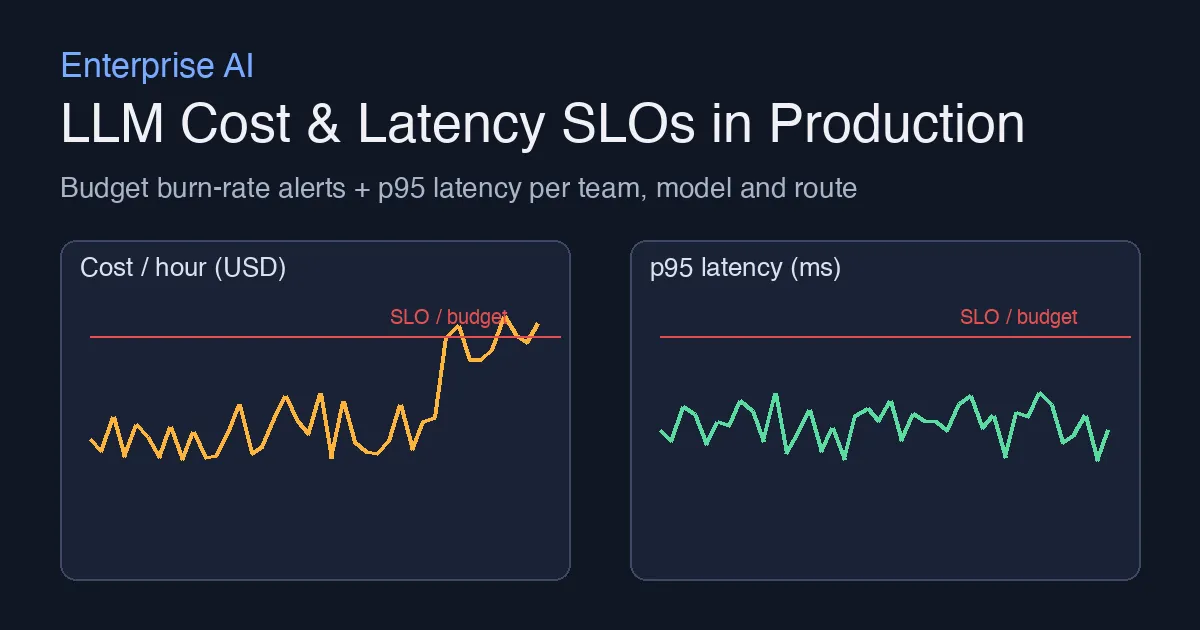
A cost dashboard tells you what happened. An SLO tells you when to act. Once a few teams share an Azure OpenAI platform, the questions change from “how much did we spend” to “is the payments bot about to blow its daily budget right now, and is the 2.8 second p95 a model problem or a retrieval problem?”. This post defines cost and latency SLOs per team and deployment, computes burn rates in KQL over two windows, and wires alerts that page on real incidents and open a ticket for slow drift. It builds on the cost dashboard and the OpenTelemetry tracing from earlier posts; if you have those, this is a day of work.
Why spend needs an SLO, not a threshold
Classic SRE SLOs are about availability: “99.9% of requests succeed within 500 ms”. LLM workloads add a second resource that behaves like availability: budget. A team has a monthly token budget, it burns it unevenly, and a runaway batch job can consume a week of budget in an hour. Treating budget as an error budget gives you the same tools SRE already has:
- a target (USD per hour per team, derived from the monthly budget);
- a burn rate (actual spend / budgeted spend over a window);
- multi-window alerts so one noisy five minutes does not page anyone, but a sustained spike does.
Latency gets the same treatment. Azure OpenAI latency scales with output tokens, so a flat “p95 under 1 second” target is wrong for a summarisation route and too loose for an autocomplete route. The SLO must be per route or deployment, not per resource.
Step 1: Write the SLOs down
Keep the definitions in the repo next to the Bicep so they are reviewed like code. One YAML block per team is enough:
1
2
3
4
5
6
7
8
9
10
11
12
# slo/payments.yaml
team: payments
deployment: gpt-4o
cost:
  monthly_budget_usd: 8600      # ≈ $12/hour
  page_burn: { short: 2.0, long: 1.5 }   # 1h and 6h windows
  ticket_burn: { short: 1.2, long: 1.1 } # 6h and 24h windows
latency:
  p95_ms: 2500
  window_minutes: 10
errors:
  rate_pct: 2.0                 # 429 + 5xx over total
Two burn thresholds, two windows each: the page pair catches a runaway job within an hour, the ticket pair catches a team quietly running 20% over for a day. Both are the standard Google SRE multi-window shape; nothing LLM-specific except that the “errors” are dollars.
Step 2: Price every call in 5-minute bins
If the gateway is Azure API Management with the token-metrics policy from the quota post, ApiManagementGatewayLogs already carries team (from the subscription) and the token counts. If not, AzureDiagnostics with the RequestResponse category and a team header gives you the same shape. The pricing table lives in a datatable so changing a price is a one-line edit:
let prices = datatable(model:string, in_per_1k:real, out_per_1k:real) [
  "gpt-4o",       0.0025, 0.0100,
  "gpt-4o-mini",  0.00015, 0.0006
];
let calls = ApiManagementGatewayLogs
| where TimeGenerated > ago(7d)
| extend team = tostring(BackendRequestHeaders["x-team"]),
         model = tostring(BackendResponseHeaders["x-ms-model"]),
         prompt_tokens = toint(BackendResponseBody.usage.prompt_tokens),
         completion_tokens = toint(BackendResponseBody.usage.completion_tokens),
         latency_ms = TotalTime
| join kind=inner prices on model
| extend cost_usd = prompt_tokens/1000.0*in_per_1k + completion_tokens/1000.0*out_per_1k;
calls
| summarize cost_usd = sum(cost_usd),
            p95_ms = percentile(latency_ms, 95),
            err_pct = 100.0 * countif(ResponseCode in (429) or ResponseCode >= 500) / count()
  by team, model, bin(TimeGenerated, 5m)
Save that as a function LlmSlo5m() in the workspace. Everything below reads from it, so the pricing logic exists in exactly one place.
Step 3: Burn rate over two windows
The budget per hour comes from the YAML; the simplest way to get it into KQL is a second datatable generated at deploy time from the slo/*.yaml files (a 20-line script in the pipeline). Then:
let budgets = datatable(team:string, model:string, budget_per_hour:real) [
  "payments", "gpt-4o", 12.0,
  "search",   "gpt-4o-mini", 8.0
];
let burn = (window:timespan) {
  LlmSlo5m()
  | where TimeGenerated > ago(window)
  | summarize cost_usd = sum(cost_usd) by team, model
  | join kind=inner budgets on team, model
  | extend burn = cost_usd / (budget_per_hour * (window / 1h))
  | project team, model, burn
};
burn(1h)  | project team, model, burn_1h = burn
| join kind=inner (burn(6h) | project team, model, burn_6h = burn) on team, model
| where burn_1h > 2.0 and burn_6h > 1.5
A row coming out of that query is a page. The and is the whole trick: a single expensive five-minute bin pushes burn_1h over 2 but leaves burn_6h near 1, so nobody is woken for one re-indexing run that finished on its own. A job that keeps going lifts both windows within about 90 minutes.
The latency alert is a plain percentile over the SLO window:
LlmSlo5m()
| where TimeGenerated > ago(10m)
| summarize p95_ms = percentile(p95_ms, 95) by team, model
| join kind=inner (datatable(team:string, model:string, slo_ms:real) [
    "payments", "gpt-4o", 2500 ]) on team, model
| where p95_ms > slo_ms
Step 4: One board, one row per team
A single workbook grid joining the 1h and 6h burn, the current p95 and the error rate is what on-call actually looks at. The State column is a KQL case() over the same thresholds the alerts use, so the board and the pager never disagree.
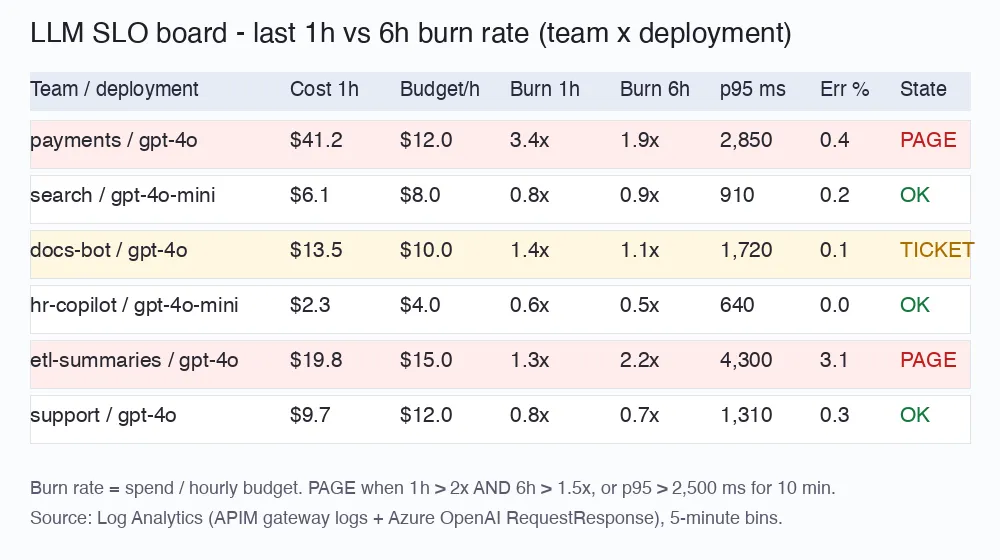 The board after a week in production: payments is paging on cost (3.4x over one hour, 1.9x over six), etl-summaries is paging on latency and 429s, docs-bot has a ticket for slow drift.
The two PAGE rows above tell different stories, and that is the point of putting cost and latency side by side. payments is expensive but fast: a new prompt doubled the output tokens, and the fix is a prompt change. etl-summaries is expensive and slow and throwing 429s: it is hitting the deployment’s TPM limit and retrying, so every retry is paid for twice. The fix there is the Batch API or a quota bump, not a prompt edit.
Step 5: Wire the alerts
Two scheduled query rules per team is manageable with Bicep in a loop over the YAML files. The page rule runs every 5 minutes over the burn query; the ticket rule runs hourly over the 6h/24h pair with the lower thresholds and posts to the team’s work-item queue instead of the on-call rotation.
1
2
3
4
5
6
7
8
9
10
11
12
13
14
15
16
17
18
19
resource pageRule 'Microsoft.Insights/scheduledQueryRules@2023-03-15-preview' = {
  name: 'llm-burn-page-${slo.team}'
  location: location
  properties: {
    severity: 1
    evaluationFrequency: 'PT5M'
    windowSize: 'PT6H'
    scopes: [ logAnalytics.id ]
    criteria: {
      allOf: [ {
        query: loadTextContent('./kql/burn-page.kql')
        timeAggregation: 'Count'
        operator: 'GreaterThan'
        threshold: 0
      } ]
    }
    actions: { actionGroups: [ onCallActionGroup.id ] }
  }
}
Put the team name in the alert title and the top three most expensive operation values from the last hour in the alert body (a second KQL query in the same rule). The person paged at 2 a.m. should not have to open a workbook to learn it was SummariseInvoice again.
What changed for the users
After a month with the SLOs on the shared platform:
- the platform team stopped reading the cost dashboard every morning; the two page alerts fired four times, all real (two runaway batch jobs, one prompt regression, one TPM limit);
- ticket alerts caught two teams drifting 20-30% over budget a week before month-end instead of at the invoice;
- the per-route p95 targets ended one long argument: the summarisation route is allowed 4 seconds, autocomplete is held to 800 ms, and nobody compares the two any more;
- total spend fell about 11%, almost entirely from the two batch jobs that used to run unnoticed for days.
The data was already there in the logs. Turning it into an SLO with a burn rate is what made it actionable.
Related
- Enterprise AI: A Cost Observability Dashboard for Azure OpenAI with Log Analytics, KQL and Workbooks
- Enterprise AI: LLM Observability with OpenTelemetry in .NET - Tracing Tokens, Cost and Quality per Request
- Enterprise AI: Per-Team Token Quotas and Chargeback for Azure OpenAI with Azure API Management
- Azure OpenAI Batch API in .NET