Go pprof Profiling Guide: CPU, Goroutine and Mutex Profiles on One Service
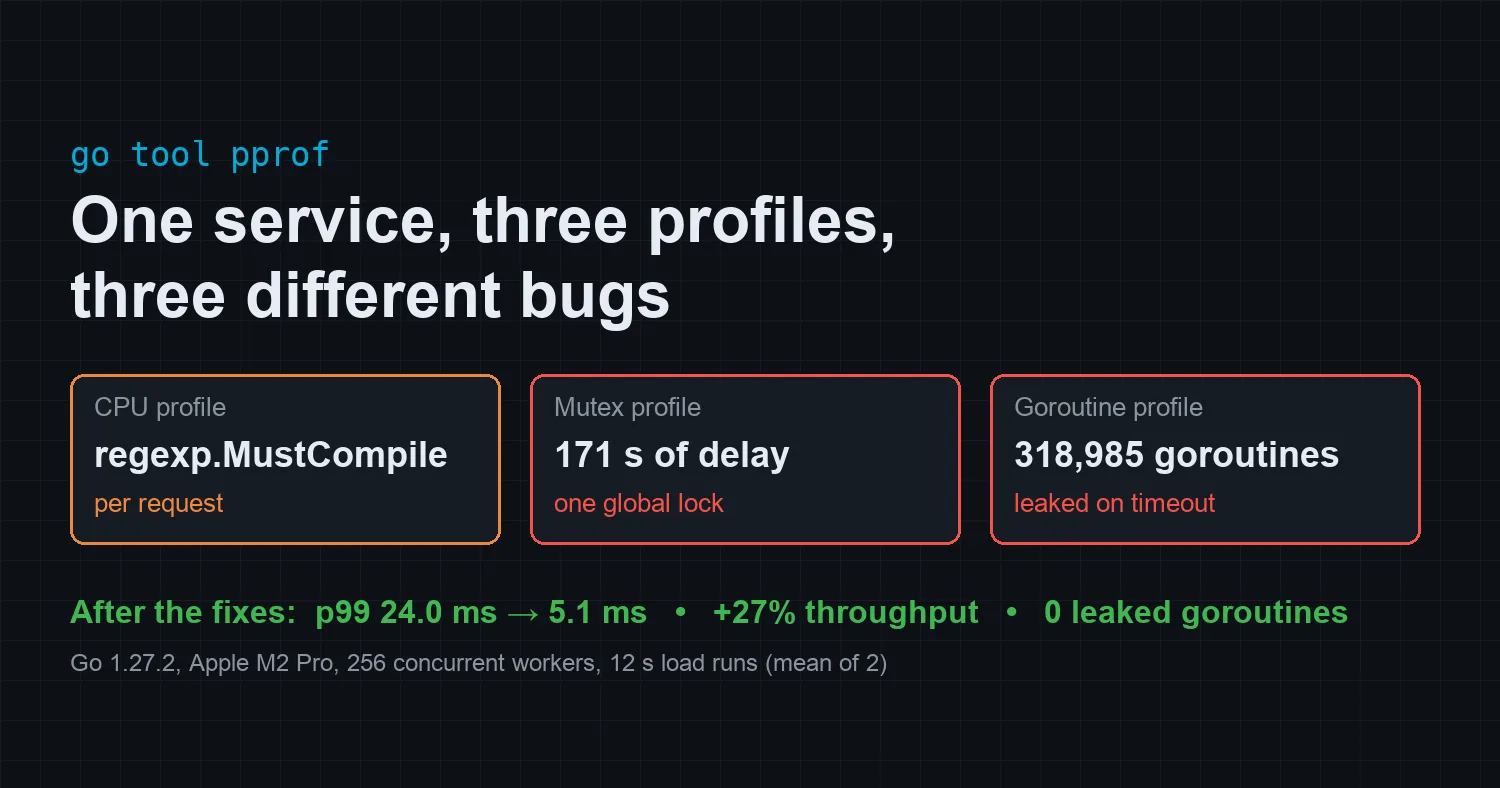
Hands-on Go pprof guide: CPU, goroutine and mutex profiles on one gateway found three bugs. The fixes cut p99 from 24 ms to 5.1 ms.
Most Go pprof tutorials stop at go tool pprof -top on a CPU profile. That works when the slow code is the code burning CPU. It falls short when the CPU profile shows the symptom and another profile holds the cause, which is the usual case in a real service.
This guide profiles one small service with three profiles, in the order you would reach for them during an incident:
- CPU profile: where is the time going?
- Goroutine profile: who owns all these goroutines?
- Mutex profile: who is everyone waiting on?
Each profile found a different bug. Fixing all three cut p99 latency from 24.0 ms to 5.1 ms and raised throughput by 27% at the same concurrency. Every number and screenshot below comes from real runs on Go 1.27.2 on an Apple M2 Pro (12 cores).
The service under test
gateway-demo is an LLM-gateway-shaped request path in about 200 lines of Go. Each request does three things:
- Redacts PII from the prompt with three regular expressions (email, card-number-like digits, API-key-shaped tokens).
- Charges the tenant’s token quota and appends an audit record.
- Calls an upstream model with a 5 ms timeout. The fake model sleeps 0.5–6 ms, so about a fifth of calls time out on purpose.
A load loop runs 256 goroutines against handle for a fixed time, then prints throughput, p50/p99 latency, upstream timeouts, and how many goroutines are still alive after the load stops.
The slow build has three bugs that each pass code review on their own:
1
2
3
4
5
6
7
8
9
10
11
12
13
14
15
16
17
18
19
20
21
22
23
24
25
26
27
28
29
30
31
32
33
// Bug 1: compile every regexp on every request.
func redactSlow(prompt string) string {
	for _, p := range piiPatterns {
		re := regexp.MustCompile(p) // compiled on every request
		prompt = re.ReplaceAllString(prompt, "[REDACTED]")
	}
	return prompt
}

// Bug 2: hashing, formatting and an append, all under one global lock.
func (q *quotaSlow) charge(tenant, prompt string, tokens int64) {
	q.mu.Lock()
	defer q.mu.Unlock()
	// Everything below runs while every other request waits.
	sum := sha256.Sum256([]byte(tenant + prompt))
	q.used[tenant] += tokens
	q.audit = append(q.audit, fmt.Sprintf("%s:%d:%s", tenant, tokens, hex.EncodeToString(sum[:8])))
	if len(q.audit) > 4096 {
		q.audit = q.audit[:0]
	}
}

// Bug 3: an unbuffered channel plus a timeout leaks the sender.
func callUpstreamSlow(ctx context.Context) (string, error) {
	ch := make(chan string) // unbuffered: the sender blocks forever if we time out
	go func() { ch <- fakeModel() }()
	select {
	case r := <-ch:
		return r, nil
	case <-ctx.Done():
		return "", ctx.Err()
	}
}
Step 0: expose pprof safely
Profiles are only useful if you can collect them from the running process. The usual setup takes four lines:
1
2
3
4
5
6
7
8
import _ "net/http/pprof" // registers /debug/pprof/* on http.DefaultServeMux

func main() {
	runtime.SetMutexProfileFraction(5)  // sample 1 in 5 contended mutex events
	runtime.SetBlockProfileRate(10_000) // sample blocking events of 10µs or more
	go func() { log.Println(http.ListenAndServe("localhost:6060", nil)) }()
	// ...
}
Two points matter in production:
- Bind pprof to localhost or an internal admin port, never to the public listener. The goroutine dump at
?debug=2contains full stacks. A CPU profile request also costs real CPU for as long as it runs. - Mutex and block profiles are off by default. Without
SetMutexProfileFractionthe mutex endpoint returns an empty profile, which looks exactly like “no contention”. Turn the sampling on at startup, not during an incident.
Here is how the profiles below were collected while the load ran:
1
2
3
curl -o cpu-slow.pb.gz       'http://localhost:6060/debug/pprof/profile?seconds=10'
curl -o goroutine-slow.pb.gz  http://localhost:6060/debug/pprof/goroutine
curl -o mutex-slow.pb.gz      http://localhost:6060/debug/pprof/mutex
I built the binary with go build -trimpath so that source views show gatewaydemo/main.go instead of a path from my machine. That is worth doing for any profile you will paste into a ticket.
Step 1: the CPU profile shows the symptom
1
go tool pprof -http=localhost:8081 gateway-demo cpu-slow.pb.gz
-http opens the interactive web UI. The flame graph (View → Flame Graph) is the fastest way to see where 10 seconds of samples went:
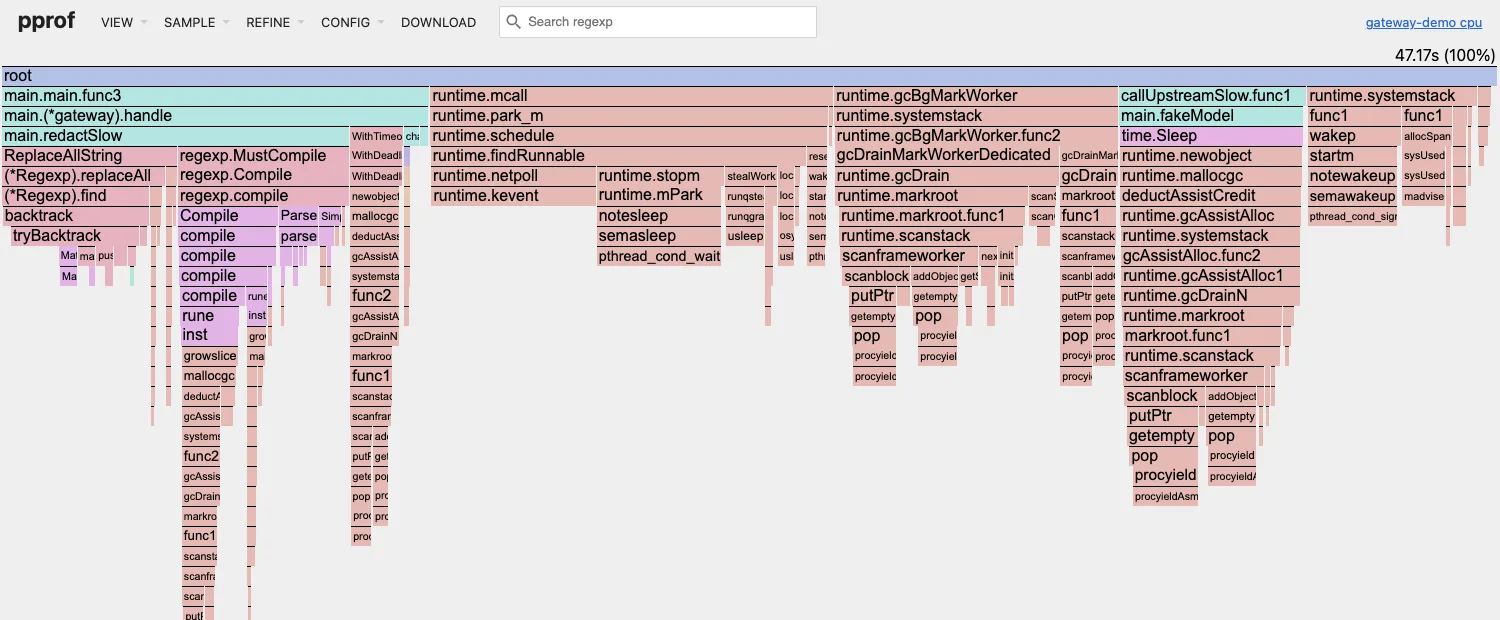
There are two stories in this graph:
main.redactSlowis 23.3% of CPU (10.97 s cumulative). The line view (-list) splits it almost in half: 5.43 s on line 44 (regexp.MustCompile) and 5.54 s on line 45 (ReplaceAllString). Recompiling three patterns on every request is half the cost of redaction. That is bug 1, and the CPU profile finds it directly.- The garbage collector is the biggest consumer.
runtime.scanstackalone is 35.1% of all CPU (16.57 s).runtime.gcAssistAlloc, the GC work that allocating goroutines are forced to do, is another 10.17 s. In the flame graph that cost even appears underregexp.MustCompile, because each allocation it makes triggers an assist.
scanstack is the GC walking goroutine stacks. Heavy stack scanning means there are a lot of stacks, and a CPU profile cannot tell you whose they are. The right move is not to tune GOGC (we tried that on a different service in GOGC=off with runtime.SetMemoryLimit). The right move is to switch profiles.
Step 2: the goroutine profile names the leak
1
go tool pprof -http=localhost:8084 gateway-demo goroutine-slow.pb.gz
I took this snapshot after the load generator had stopped and every request had returned. A healthy service should be back to a handful of goroutines:

There are 318,985 goroutines, every one parked in chansend inside callUpstreamSlow.func1. The text form says the same thing in a form you can grep or paste into an incident channel:
1
2
3
4
$ curl -s 'http://localhost:6060/debug/pprof/goroutine?debug=1' | head -3
goroutine profile: total 318985
318980 @ 0x… 0x… 0x… 0x… 0x…
#	0x…	main.callUpstreamSlow.func1+0x…	gatewaydemo/main.go:106
318,980 is exactly the number of upstream timeouts the load generator counted. Every time the context won the select, nobody was left to receive from the unbuffered channel. The model goroutine then blocked on ch <- fakeModel() forever, holding its stack, and the GC scanned that stack on every cycle. That is the scanstack tower from step 1.
The fix is one character of intent. Give the channel a buffer of one so that the sender can always finish:
1
2
3
4
5
6
7
8
9
10
func callUpstreamFast(ctx context.Context) (string, error) {
	ch := make(chan string, 1) // buffered: the sender always finishes
	go func() { ch <- fakeModel() }()
	select {
	case r := <-ch:
		return r, nil
	case <-ctx.Done():
		return "", ctx.Err()
	}
}
In a real gateway the upstream call should also take ctx, so that the HTTP request is cancelled and does not run to completion unobserved. Go context cancellation for LLM streaming covers that half.
To check that the leak really caused the GC cost, I ran a third build, noleak, which fixes only this bug. In its CPU profile runtime.scanstack fell from 16.57 s to 1.28 s, and regexp.MustCompile fell from 5.43 s to 1.85 s once its allocations stopped paying for stack scans. p99 fell from about 24 ms to about 5.3 ms. One profile switch found most of the latency.
Step 3: the mutex profile finds the lock everyone queues on
With the leak gone, the request path gets faster, and more requests per second pile into whatever is serialised. That makes the mutex profile the next stop:
1
go tool pprof -http=localhost:8085 gateway-demo mutex-slow.pb.gz   # then View → Source
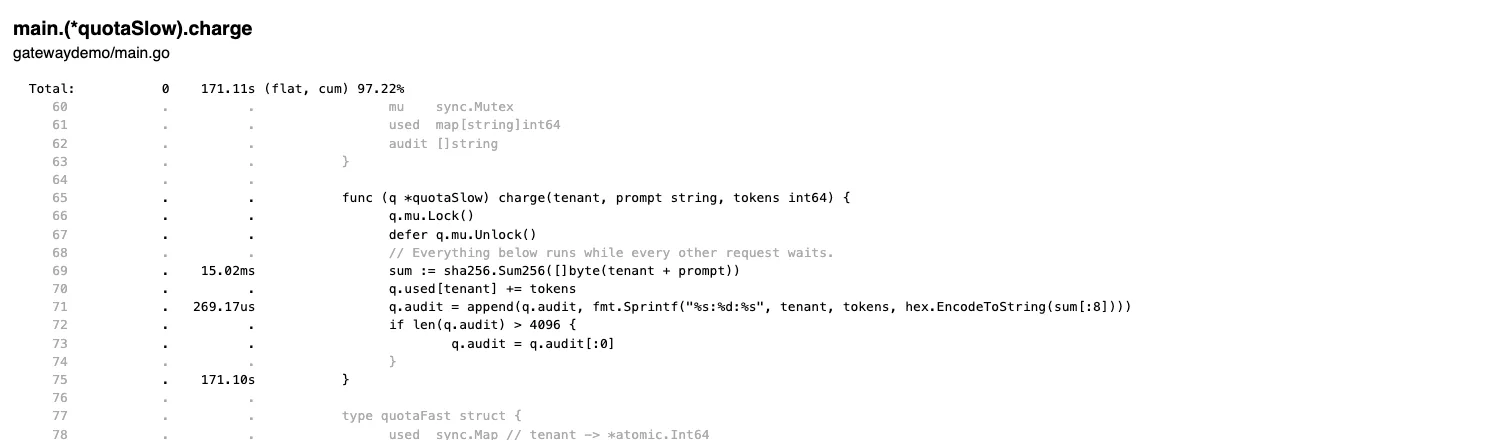
Two things about reading this view trip people up:
- The delay lands on the line that releases the lock, not on the line that waits for it. Go’s mutex profile records the stack of the goroutine that held a contended lock at the moment it unlocks. Because of
defer, that is the closing brace on line 75. Read it as “the critical section ending here made others wait 171 s in total”. - 171 s of delay in a 14-second-old process is not a bug in pprof. Delay is summed across waiters, and 256 goroutines queue on this lock at the same time. The
/debug/pprof/mutexendpoint is also cumulative since the process started; use?seconds=30to get a delta for a window.
This lock gets worse after the leak fix. In the noleak build, quotaSlow.charge grew to 362 s of mutex delay over a similar window, because requests now reach it faster. Fixing one bottleneck often makes the next one louder. Profile again after every fix.
The fix keeps the critical section empty: hash outside any lock, use one atomic counter per tenant, and make audit logging best-effort through a buffered channel:
1
2
3
4
5
6
7
8
9
10
11
12
func (q *quotaFast) charge(tenant, prompt string, tokens int64) {
	sum := sha256.Sum256([]byte(tenant + prompt)) // outside any lock
	c, ok := q.used.Load(tenant)
	if !ok {
		c, _ = q.used.LoadOrStore(tenant, new(atomic.Int64))
	}
	c.(*atomic.Int64).Add(tokens)
	select {
	case q.audit <- tenant + ":" + hex.EncodeToString(sum[:8]):
	default: // audit is best-effort; never block the request path
	}
}
After the fix, total mutex delay fell from 176 s to 10.7 s, and only 0.24 s of it is in the quota code. The rest is runtime-internal locking (the scheduler and stack allocation), which is normal at 256-way concurrency.
Bug 1 gets the obvious fix: compile the patterns once at package init (var compiledPII = ... with regexp.MustCompile) and reuse the *regexp.Regexp values, which are safe for concurrent use.
Step 4: prove the fix with -diff_base
“It feels faster” is not evidence. pprof can subtract one profile from another:
1
go tool pprof -top -cum -diff_base=cpu-slow.pb.gz gateway-demo cpu-fast.pb.gz
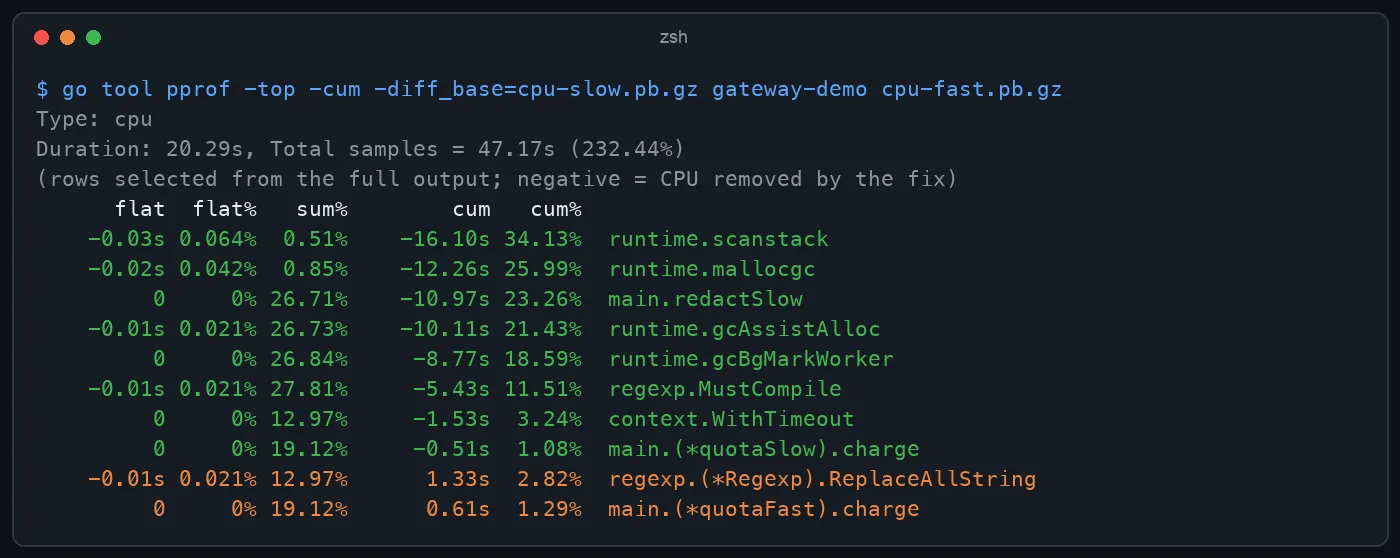
Negative numbers are CPU the fix removed. Positive numbers are CPU it added. Both directions matter here:
- The GC rows dominate the savings (
scanstack−16.10 s,gcAssistAlloc−10.11 s). The leak was the most expensive bug, even though no line ofcallUpstreamSlowwas hot in the CPU profile. ReplaceAllStringwent up by 1.33 s. It is not slower; the fixed build served 42% more requests during the profiled runs (73,647 vs 51,840 req/s), so it ran more often. Normalise by work done: CPU per request fell from roughly 90 µs to 48 µs.
-diff_base works the same way with the web UI (-http) and with heap and mutex profiles. Attach its output to the pull request that claims the speed-up.
Results
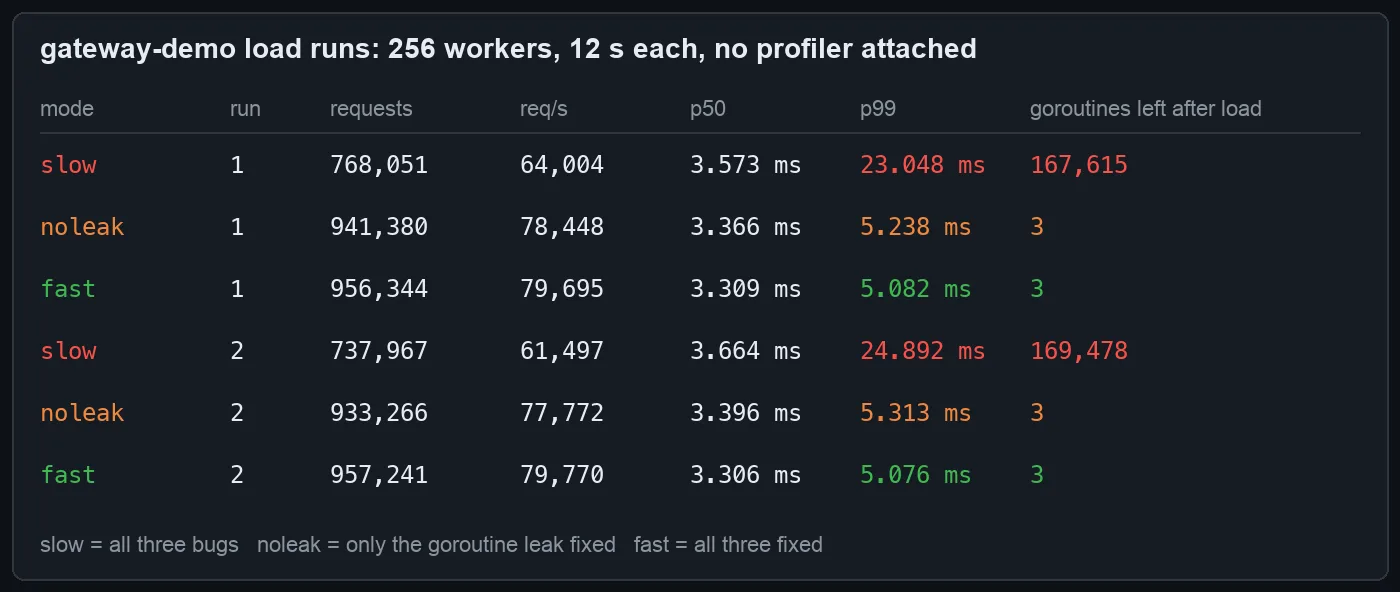
Profiles change what they measure, so I ran each build twice for 12 seconds without collecting a profile:
| Build | Throughput (mean of 2) | p99 (mean of 2) | Goroutines left after load |
|---|---|---|---|
| slow (all three bugs) | 62,751 req/s | 23.97 ms | ~168,500 |
| noleak (leak fixed only) | 78,110 req/s | 5.28 ms | 3 |
| fast (all three fixed) | 79,733 req/s | 5.08 ms | 3 |
The leak fix alone delivers most of the p99 win. The lock and regexp fixes add the last 2% of throughput and about 0.2 ms of p99 at this load, and they leave far more CPU headroom. That headroom shows up as lower cost per request rather than lower latency until the machine runs out of cores.
Which profile answers which question
| Question during an incident | Profile | Endpoint | Gotcha |
|---|---|---|---|
| Where does CPU time go? | CPU | /debug/pprof/profile?seconds=N | Shows symptoms. GC time means look elsewhere. |
| Why is memory or GC busy? | heap (-sample_index=alloc_space) | /debug/pprof/heap | inuse ≠ alloc; see the alloc_space deep dive |
| Is something leaking or stuck? | goroutine | /debug/pprof/goroutine (?debug=1 for text) | Take it after load drops, then compare with in-flight work |
| Who serialises requests? | mutex | /debug/pprof/mutex | Off until SetMutexProfileFraction; cumulative; blames the unlocker |
| Where do goroutines wait on channels or I/O? | block | /debug/pprof/block | Off until SetBlockProfileRate; high rates cost CPU |
| Did my change help? | any, with -diff_base | — | Compare profiles of equal duration and load |
Takeaways
- A hot GC in the CPU profile is a pointer, not a diagnosis. Here 35% of CPU in
scanstackcame from a goroutine leak that a CPU profile cannot attribute. - Take the goroutine profile when load is low. A count that does not drop back to near-idle is a leak, and the profile groups the leaked goroutines by the exact line that parked them.
- Turn on mutex and block sampling at startup. An empty mutex profile usually means sampling was off, not that the locks are uncontended.
- Re-profile after every fix. Removing the leak made the global lock more contended (171 s → 362 s of delay).
- Ship the
-diff_baseoutput with the fix, and normalise by requests served, not by raw seconds.
We use this CPU → goroutine → mutex → diff loop on the Go services behind Lamplit Labs’ products, including the LLM gateway in the posts below. The same habit of measuring, changing one thing and re-measuring with a diff as the evidence is at the core of Pulse, Lamplit Labs’ self-improving automation product, coming soon.
Related reading
- Go pprof alloc_space: 2.87 GB of garbage from one
+=in a loop: the heap-profile half of this guide. - Go pprof vs SLO Burn Rate: Finding the p99 Leak Before the Pager Fires: when to start profiling, driven by an SLO alert.
- Go Context Cancellation for LLM Streaming and Agent Calls: the right way to stop the upstream call that leaked here.
- GOGC=off with runtime.SetMemoryLimit: GC tuning, for when the GC cost is real and not a leak.
- Hedged Requests and Load Shedding in Our Go LLM Gateway: tail-latency tools beyond profiling.
- Pulse: Lamplit Labs’ self-improving automation product, coming soon: the product mentioned above.