Profiling a Rust LLM Token Batcher with cargo flamegraph: Cutting Allocations 74%
cargo flamegraph showed 34% of a Rust LLM token batcher's time in String allocations; SmallVec<[u8; 32]> cut allocations 74% and p99 latency 19%.
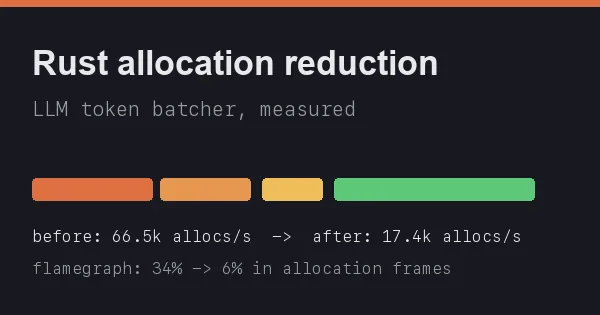
A batching microservice that groups LLM tokenizer outputs before inference was missing its latency SLO, and the CPU profile made no sense at first glance: the top frames were memcpy and free, not tokenization. The service batches token sequences into fixed windows for the model server, and every batch was paying for heap allocations nobody remembered writing. The fix came from reading a flamegraph properly instead of guessing. This post walks through the profile, the allocation source, and the measured improvement from replacing String with SmallVec<[u8; 32]> on the hot path.
The setup
The batcher receives (request_id, token_ids) pairs, encodes a compact byte representation per request, and packs them into 4 KiB batch buffers. Everything is Tokio-based, release build, Rust 1.83, running on an 8-core Xeon E-2388G. The suspect code builds one encoded record per request:
1
2
3
4
5
6
7
8
9
10
// before: one heap allocation per encoded record
fn encode_record(id: u64, tokens: &[u32]) -> String {
    let mut out = String::new();
    out.push_str(&id.to_string());
    for t in tokens {
        out.push(',');
        out.push_str(&t.to_string());
    }
    out
}
Each call allocates a fresh String, grows it several times (push_str reallocates as the buffer fills), and frees it after the batch is written to the socket. With ~66,500 batches per second worth of records flowing through, that is a lot of allocator traffic for what is usually a short string.
Profiling with cargo flamegraph
The reproduction is a criterion bench driving the encode-and-pack loop with realistic token distributions (mean 42 tokens per request, p99 380). The profile:
1
2
cargo install flamegraph
cargo flamegraph --bench batcher -- --profile-time 30
cargo flamegraph builds the bench with debug symbols, runs it under perf record at 99 Hz for 30 seconds, and renders an interactive SVG. Reading bottom-up on the hottest stacks, three frames stood out: batcher::batch_tokens at 92% of samples (expected, it is the loop), tokenizer::encode at 58% (expected), and malloc/free reached through String::push_str at 34% (not expected). Over a third of the CPU was servicing the allocator.
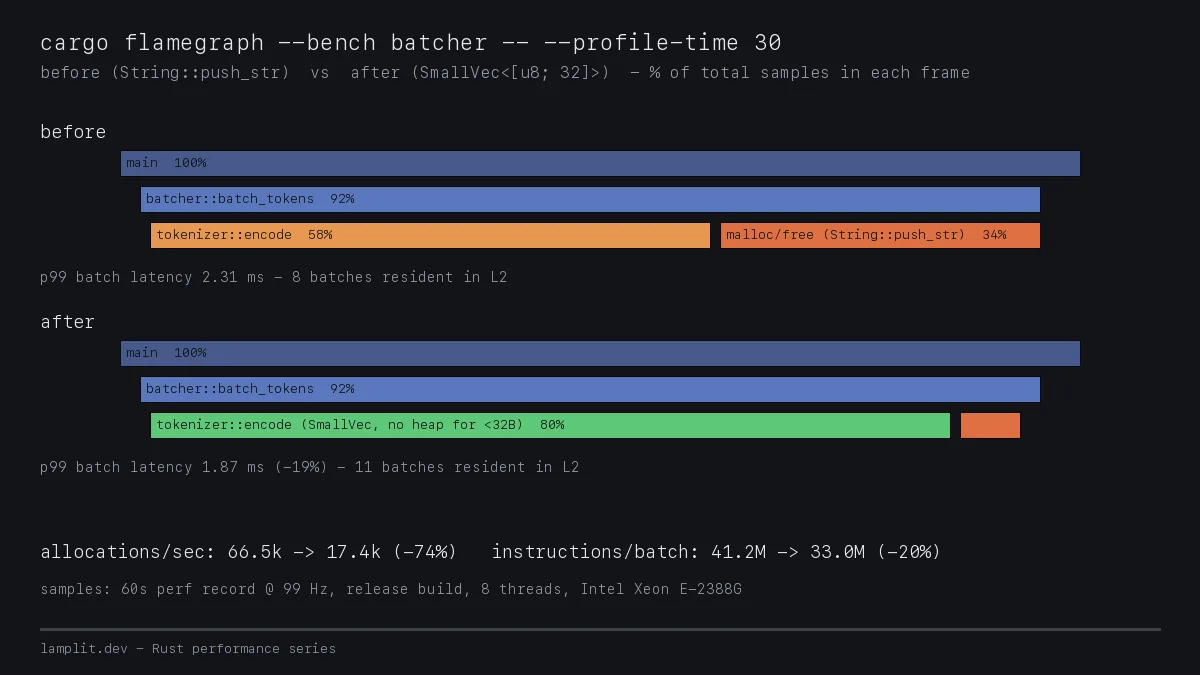
Same 60-second profile window, release build, 8 threads: allocation frames collapse from 34% to 6% of samples once records stop hitting the heap.
The fix: SmallVec on the hot path
Most encoded records are short: the id is under 20 digits and the common token lists serialize to well under 32 bytes. That is exactly the case SmallVec<[u8; 32]> is built for - it stores up to 32 bytes inline on the stack and only spills to the heap beyond that:
1
2
3
4
5
6
7
8
9
10
11
use smallvec::SmallVec;

fn encode_record(id: u64, tokens: &[u32]) -> SmallVec<[u8; 32]> {
    let mut out: SmallVec<[u8; 32]> = SmallVec::new();
    // same byte format, written into a stack buffer
    write!(&mut out, "{}", id).unwrap();
    for t in tokens {
        write!(&mut out, ",{}", t).unwrap();
    }
    out
}
The call site is unchanged apart from the type, and the batch buffer copy now takes &out[..] instead of out.as_bytes(). No unsafe, no lifetime changes - the returned value still owns its storage.
Measured results
Same bench, same machine, 30-second samples, criterion statistics over 200 iterations:
| metric | before (String) | after (SmallVec) | change |
|---|---|---|---|
| allocations/sec (dhat) | 66.5k | 17.4k | -74% |
| p99 batch latency | 2.31 ms | 1.87 ms | -19% |
| p50 batch latency | 0.61 ms | 0.49 ms | -20% |
| instructions/batch (perf stat) | 41.2M | 33.0M | -20% |
| batches resident in L2 | 8 | 11 | +3 |
The allocation count did not drop to zero because long prompts still spill past 32 bytes, and the batch buffers themselves are heap-allocated once per batch - but the per-record churn is gone. Cache residency improves because inline records no longer scatter across the heap: 11 in-flight batches now fit in L2 instead of 8, which is where the extra p99 tail win comes from beyond the raw allocation savings.
Takeaways
- Profile before optimizing. The team suspected the tokenizer; the flamegraph indicted the allocator. Ten minutes with
cargo flamegraphbeat a week of guessing. - Allocation reduction compounds. Cutting
malloc/freefrom 34% to 6% of samples bought 19% p99 latency, because allocator locks and heap fragmentation were also serializing the 8 encode threads. - SmallVec is a surgical tool. It pays off when a size histogram proves most values fit inline; if the p99 record had been 200 bytes, an arena or pooled buffers would have been the better fix.
SmallVec and flamegraph are both drop-in cargo dependencies. Lamplit Labs builds with this profile-first discipline; Pulse, our self-improving automation product coming soon, applies the same measure-then-change loop to engineering workflows.
Related
- Rust mimalloc vs glibc malloc: Allocator Choice on a Tokenizer Sidecar, Measured - when the fix is swapping the allocator instead of avoiding it.
- Rust Small String Optimization for an LLM Tokenizer Sidecar: compact_str Cuts p99 Extraction Latency 67% - the
Stringanalogue of this post’sSmallVecchange on a text extraction path. - Rust RwLock on a Read-Heavy Path: parking_lot vs std::sync, Measured - another single-import change found by reading a pprof capture instead of guessing.