Tokio Performance Pitfalls, Measured: Blocking, Mutexes, Spawns and File I/O
Five Tokio pitfalls measured on an M2 Pro: inline CPU work took p99 from 80 us to 35 ms, and a lock held across .await cut throughput 400x.
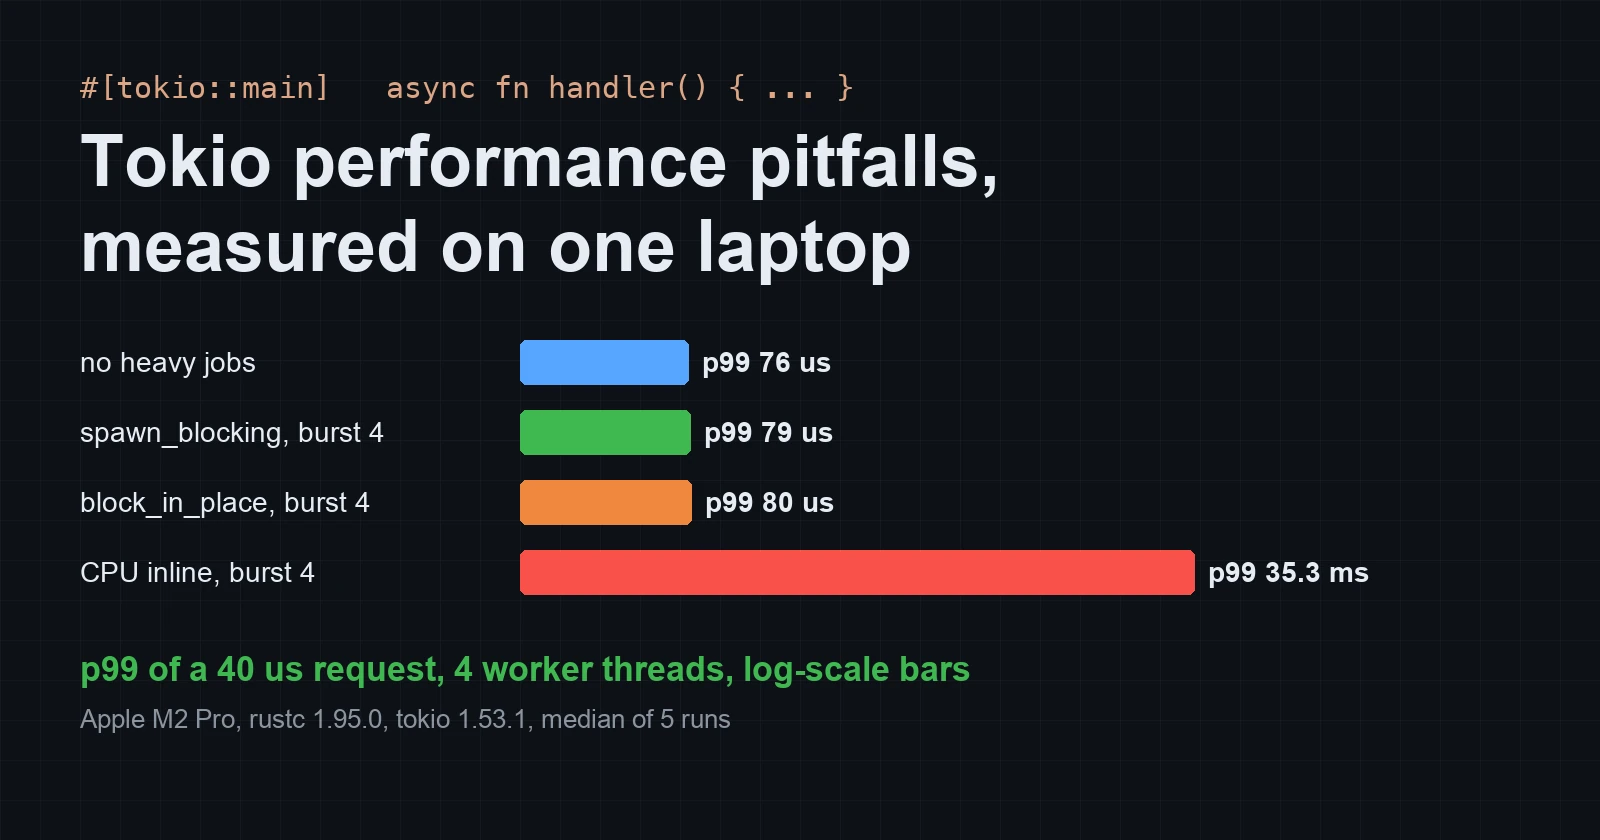
Most Tokio advice is true and unquantified. “Don’t block the runtime.” “Prefer std::sync::Mutex.” “Don’t spawn too many tiny tasks.” “tokio::fs is slow.” Each of those is a real rule, but none of them tells you how big the effect is or when it starts to matter, and that is what decides whether you rewrite a handler today or leave it alone.
So I built one small bench crate, ran five pitfalls next to their fixes on one laptop, and kept every number. The crate is scripts/rust-tokio-pitfalls/ in this blog’s repository: about 470 lines of Rust, two dependencies (tokio 1.53.1 and parking_lot 0.12.5), and it builds with cargo build --offline.
The short version:
| Case | Pitfall | Fix | Effect |
|---|---|---|---|
| CPU work inline in an async task, 4 heavy jobs at once | p99 35.3 ms | spawn_blocking: p99 78.7 us | 448x on the tail, invisible below 4 |
tokio::sync::Mutex guard held across a 2 ms upstream call | 1,006.6 ms for 500 calls | drop the guard first: 2.5 ms | about 400x throughput |
tokio::sync::Mutex where no .await happens under the lock | 166.1 ns/op | std::sync::Mutex 66.9 ns/op, parking_lot 29.6 | 2.5x to 5.6x |
tokio::spawn per item of ~0.3 us work | 519 ns/item | 16 chunked tasks: 80 ns/item | 6.5x |
tokio::fs::read awaited in a loop | 20.6 us/file | std::fs in one spawn_blocking: 13.5 us/file | 1.5x |
All numbers are medians of 5 runs on an Apple M2 Pro (8 performance + 4 efficiency cores) with rustc 1.95.0, Tokio’s multi-thread runtime pinned to 4 worker threads, and the variants interleaved inside each run so host load (1-minute load average 3.6 to 4.6 during the runs) hit every variant alike. The medians, with min and max beside each, are in scripts/data/rust-tokio-pitfalls-m2pro.json.
Pitfall 1: CPU work on a worker thread
This is the classic one. A Tokio worker thread runs one task at a time and only switches at an .await. A handler that hashes an upload, parses a large JSON body or compiles a regex without awaiting holds that worker for the whole job, and every task queued behind it waits.
The workload: an open-loop generator thread fires 4,000 light requests per second at the runtime, each about 40 us of CPU. Twenty times a second it also fires a heavy job of about 37 ms of CPU. Latency is measured from each light request’s scheduled arrival time, not from when the runtime got round to it, so a stalled runtime cannot hide its queueing delay. Every configuration does the same heavy work per second; only one thing changes: how many heavy jobs arrive at the same moment.
1
2
3
4
5
6
7
8
// the pitfall
let digest = burn(HEAVY_ITERS, seed);

// fix A: move the work to Tokio's blocking pool
let digest = tokio::task::spawn_blocking(move || burn(HEAVY_ITERS, seed)).await?;

// fix B: tell the runtime this worker is about to block; it hands the worker's queue to a new thread
let digest = tokio::task::block_in_place(|| burn(HEAVY_ITERS, seed));
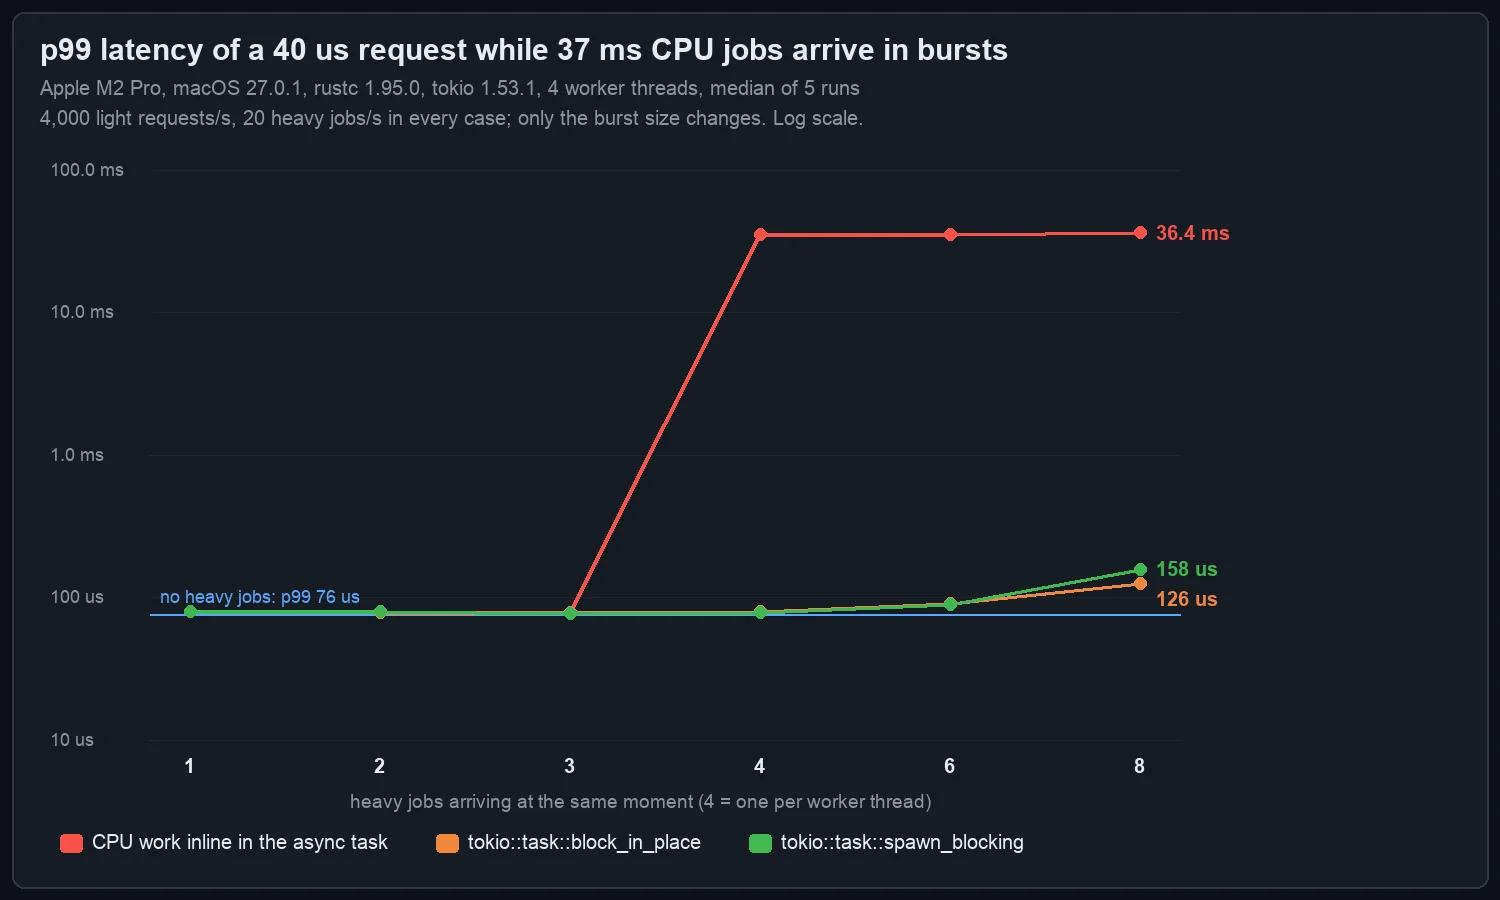
The shape is the finding. With bursts of 1, 2 or 3 heavy jobs, CPU work inline in the task costs nothing measurable: p99 79.7 us against 76.5 us with no heavy jobs at all. Three workers are busy for 37 ms, the fourth steals the queue, and 40 us requests still fit. At a burst of 4, every worker is busy at once, and p99 jumps to 35.3 ms, a 448x step, with 13.9% of all requests waiting more than 10 ms. Nothing changed except that the heavy jobs happened to line up.
That is why this pitfall ships. Your load test sends one big upload at a time and is green. Production gets four at once one afternoon, and the whole service, including the health check, stalls for the length of the longest job.
Both fixes hold the tail flat. At a burst of 4, spawn_blocking gives p99 78.7 us and block_in_place 79.8 us. At a burst of 8, twice the workers, they rise to 158 us and 126 us, because the 12-core machine is now running 8 heavy threads plus 4 workers plus the generator. The heavy jobs themselves took 37 to 39 ms in every variant: neither fix makes the work cheaper, they only move it off the threads that serve everyone else.
Which fix? spawn_blocking is the default: it works on every runtime flavour and composes with select! and timeouts on the awaiting side. block_in_place avoids moving the data to another thread, but it panics on a current_thread runtime and it blocks everything else in the same task, including other branches of a join! in that task. For CPU-heavy work at volume, a dedicated rayon pool behind a oneshot channel is the next step; the blocking pool is sized for blocking I/O (512 threads by default), not for CPU.
Pitfall 2: holding a lock across an .await
Tokio’s own docs warn about this one, and it is still the most expensive line in this post. Each of 500 tasks updates a shared map and then makes a 2 ms “upstream call”:
1
2
3
4
5
6
7
8
9
10
11
// the pitfall: the guard lives until the end of the block
let mut g = cache.lock().await;
*g.entry(key).or_default() += 1;
upstream.call().await; // every other task waits here

// the fix: scope the guard
{
    let mut g = cache.lock().await;
    *g.entry(key).or_default() += 1;
} // guard dropped
upstream.call().await;
With the guard held, the 500 calls run one after another: 1,006.6 ms for all of them, p50 latency 505 ms, p99 996 ms, about 500 calls per second. With the guard scoped, they overlap: 2.5 ms for all 500, p99 2.1 ms. That is roughly 400x throughput from moving one closing brace.
The “upstream call” here is a deadline on a dedicated spinning thread, not tokio::time::sleep. On this laptop, under load, timers were coalesced by several milliseconds (in a trial run before I wrote the spinning thread, a 50 us tokio::time::sleep came back after a median of 7.6 ms), which would have swamped the 2 ms being modelled. Your production Linux box will not do that, but your CI runner on a laptop might.
std::sync::Mutex would not have let this compile inside tokio::spawn. Holding its guard across .await makes the future !Send, and rustc says so:
1
2
3
error: future cannot be sent between threads safely
    = help: within `{async block@src/main.rs:5:18: 5:28}`, the trait `Send` is not implemented for `std::sync::MutexGuard<'_, u64>`
note: future is not `Send` as this value is used across an await
tokio::sync::Mutex exists precisely so that the guard can cross an await, so the compiler stays quiet. That is the trap: switching to the async mutex to make an error go away is often the moment this bug is written.
Pitfall 3: the async mutex where no .await happens under the lock
The inverse case. 64 tasks on 4 workers each do 20,000 increments of a shared HashMap<u64, u64>, with no .await while the lock is held:
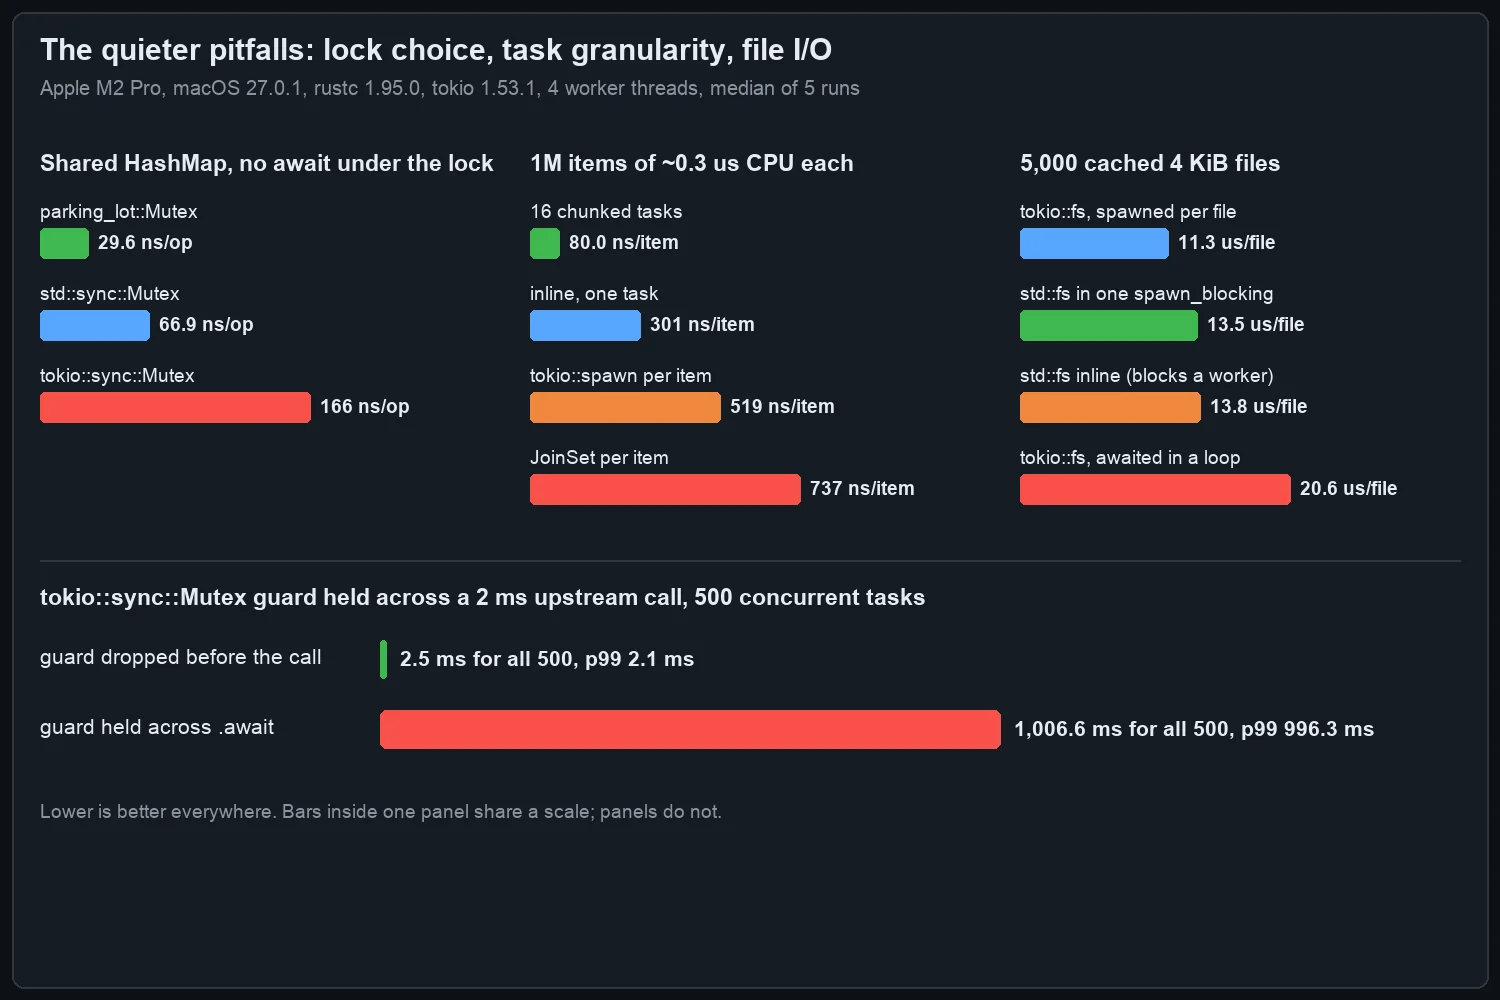
tokio::sync::Mutex costs 166.1 ns per locked update, std::sync::Mutex 66.9 ns, parking_lot::Mutex 29.6 ns. The async mutex is a semaphore with a waiter queue, and every lock().await goes through it even when nobody is waiting. For a lock that guards a few hundred nanoseconds of work and never crosses an await, the blocking mutex is both faster and safer (the compiler enforces the “never across an await” rule for you, as above). The parking_lot margin over std matches what we saw in parking_lot vs std RwLock.
The rule that falls out: use std::sync::Mutex (or parking_lot) by default, and reach for tokio::sync::Mutex only when the critical section must contain an .await - and then ask whether it really must.
Pitfall 4: one task per tiny item
tokio::spawn is cheap, not free. The bench splits a fixed 200 million rounds of CPU work into items and processes them four ways: spawn a task per item and await the handles in order, spawn into a JoinSet per item, spawn 16 tasks that each take a contiguous chunk, or run everything inline in one task.
| Work per item | spawn per item | JoinSet per item | 16 chunks | inline, 1 task |
|---|---|---|---|---|
| ~0.3 us (1M items) | 519 ns | 737 ns | 80 ns | 301 ns |
| ~3.5 us (100k items) | 1,024 ns | 1,397 ns | 921 ns | 3,513 ns |
| ~35 us (10k items) | 9,420 ns | 9,673 ns | 9,374 ns | 35,492 ns |
At ~0.3 us of work per item, a task per item is 1.7x slower than doing it all on one thread and 6.5x slower than chunking: spawning, scheduling and joining cost about 440 ns per task here (660 ns through JoinSet), more than the work itself. At ~3.5 us per item the overhead is down to about 11% over chunking, and at ~35 us it is under 1%. Chunked work on 4 workers ran 3.8x faster than inline, close to the 4x ceiling.
JoinSet was the slowest option at small sizes (737 ns vs 519 ns per item). It keeps its own linked list of tasks and wakes the joiner on each completion, which is worth paying for when you need “first one done” order or abort-on-drop, and not when you just need all of them.
Rule of thumb from these numbers: if the work per item is under about 10 us, batch it before you spawn.
Pitfall 5: tokio::fs in a loop
tokio::fs does not use async file I/O; on every platform it sends each call to the blocking pool, the same pool spawn_blocking uses. Reading 5,000 small files that were already in the page cache:
tokio::fs::readawaited one after another: 20.6 us per filestd::fs::readinline in the async task: 13.8 us per file (and a blocked worker for 69 ms)std::fs::readfor all files inside onespawn_blocking: 13.5 us per filetokio::fs::readspawned per file, all at once: 11.3 us per file
The sequential tokio::fs loop pays about 7 us per file for the hop to the blocking pool and back: 50% more than the plain syscall. Firing all reads at once wins back the time through parallel blocking threads, but it does so by starting many blocking-pool threads for 4 KiB reads. The quiet fix is one spawn_blocking around the whole batch: as fast as the inline version, without blocking a worker.
For a single config file at startup none of this matters. For a handler that reads a template, a few fragments and a manifest per request, it is the difference between one thread hop and five.
The raw output
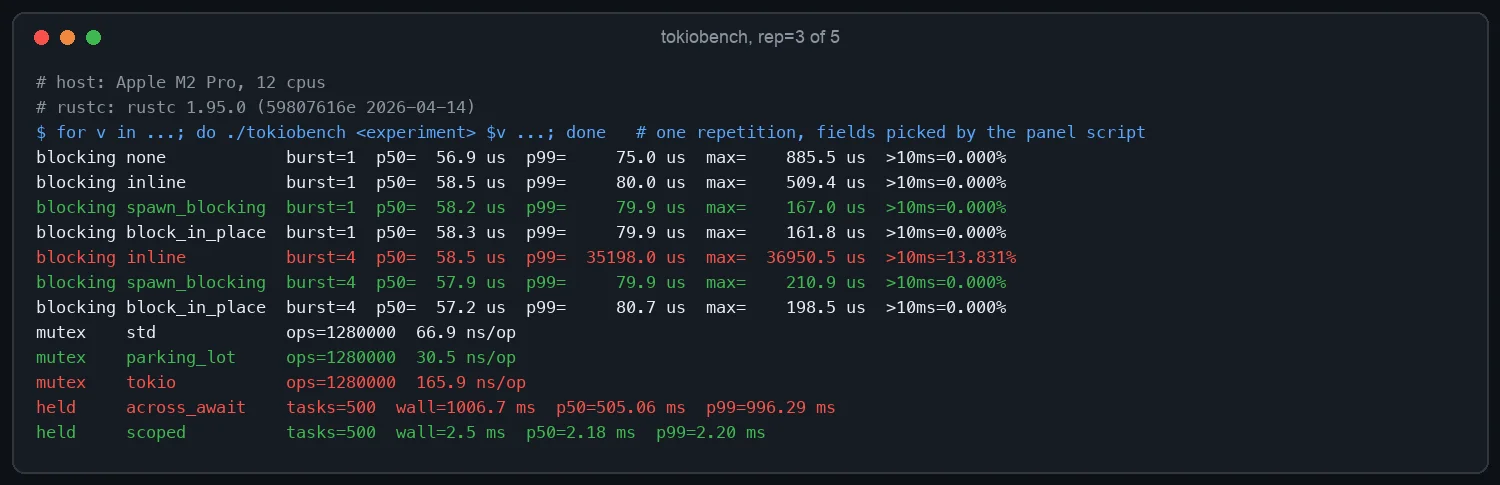
The panel below is the middle repetition of the five, straight from results.txt (fields picked and aligned by the image script, values untouched):
Reproduce it
1
2
3
bash scripts/rust-tokio-pitfalls/measure.sh /tmp/tokiobench 5     # about 7 minutes
python3 scripts/rust-tokio-pitfalls/summarise.py /tmp/tokiobench > scripts/data/rust-tokio-pitfalls-m2pro.json
python3 scripts/gen_rust_tokio_pitfalls_images.py /tmp/tokiobench
The load generator spins instead of sleeping between arrivals: with std::thread::sleep on a busy laptop, the generator itself overslept by milliseconds and showed up as tail latency in a run with no heavy jobs at all. If you port this to Linux, keep the spin, and pin the runtime to fewer workers than you have cores, as here, so the generator thread has a core of its own.
What these numbers do not cover: Linux and its scheduler, io_uring-based runtimes, networking, and current_thread runtimes. The ratios should carry over; the absolute values will not.
The checklist
- Any CPU job over about 1 ms inside an async fn goes to
spawn_blocking(or arayonpool), even if the load test is green. The failure needs heavy jobs equal to the worker count at once, so load tests with one heavy request at a time miss it. - Scope every
tokio::sync::Mutexguard so it is dropped before the next.awaitthat is not about the guarded data. - Default to
std::sync::Mutexorparking_lot::Mutex; the compiler then catches pitfall 2 for you. - Batch work under ~10 us per item before spawning; spawn per item only when items are I/O or long.
- Wrap batches of file I/O in one
spawn_blockinginstead of awaitingtokio::fscalls one by one.
We run checks like these as part of how we build Pulse, Lamplit Labs’ self-improving automation product, coming soon: every claim in a post like this one is a script in the repository that a reviewer can rerun.
Related reading
- Rust Async Under Load: Tokio Backpressure in an LLM Gateway: the other big Tokio tail-latency trap, unbounded channels.
- parking_lot vs std RwLock: the lock comparison behind pitfall 3, with readers.
- Rust RwLock vs Sharded Cache: p99: what to do when even the fast lock is contended.
- Rust Profiling Practical Guide: sample, Flame Graphs and a Counting Allocator: how to find the blocking call in the first place.
- Pulse: Lamplit Labs’ self-improving automation product, coming soon: the product mentioned above.