Rust Profiling Practical Guide: sample, Flame Graphs and a Counting Allocator, Measured
A measured Rust profiling guide: macOS sample, flame graphs and a counting allocator took a Rust log analyser from 3,256 ms to 233 ms in three fixes.
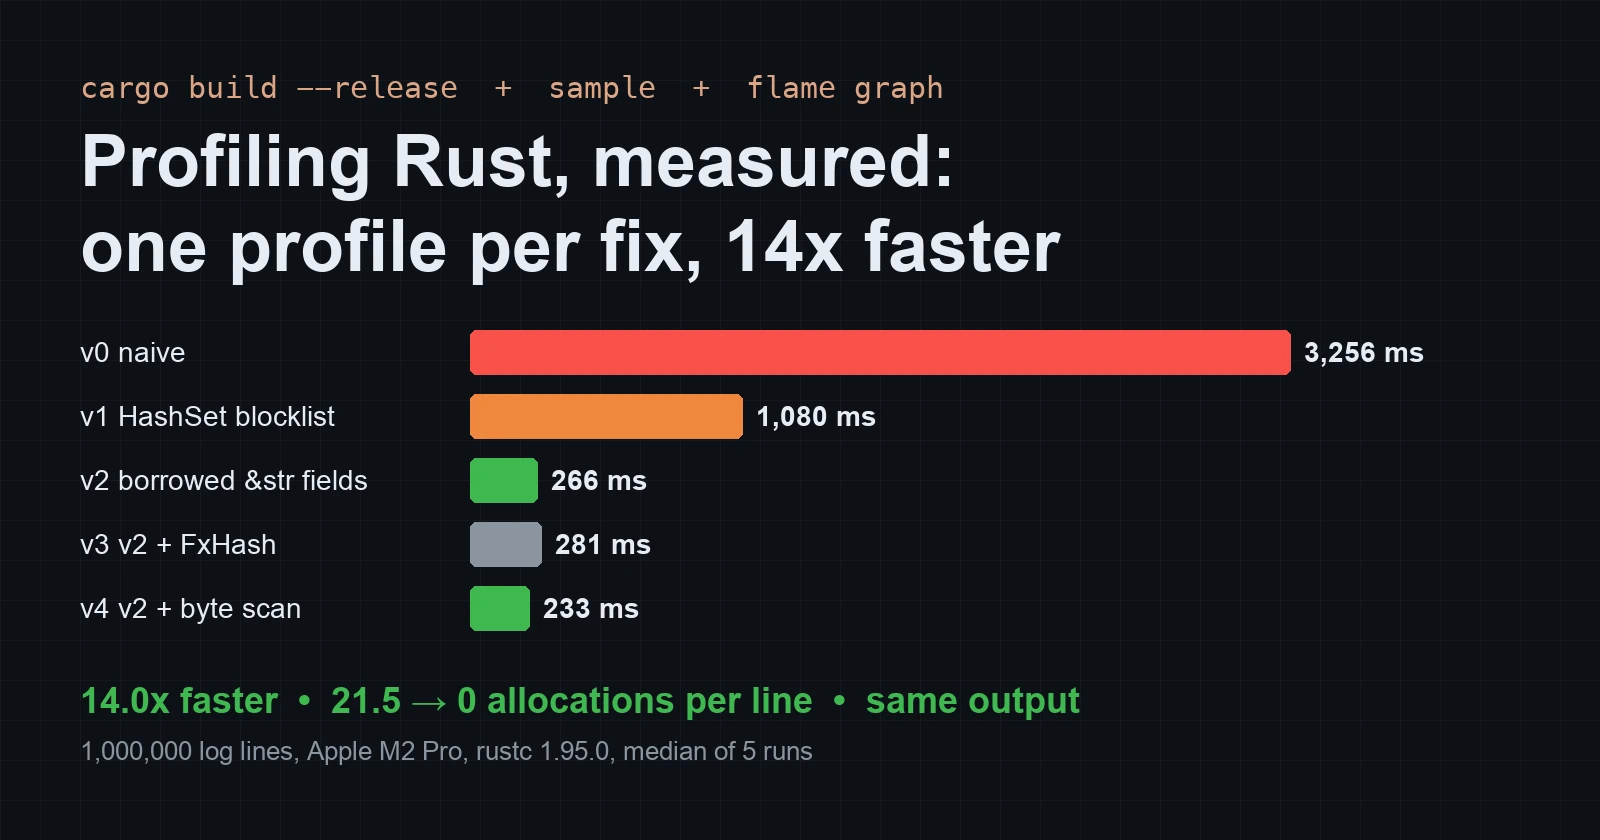
Rust gives you fast code by default, and that makes profiling it easy to put off. When a release build is slow anyway, guessing goes badly: the obvious suspect (it parses strings, so parsing must be slow) is often wrong, and the usual fix (swap in a faster hash) can make things worse. This guide uses one small, reproducible program and a loop you can run on any Mac without sudo. Profile, read the widest frame, change one thing, then measure again with the profiler detached.
Every number below comes from the scripts in this blog’s repository and was measured on one machine. The program went from 3,256 ms to 233 ms (14.0x) in four steps. One of those steps was a “fix” the measurements rejected.
The program under test
logstat reads an LLM gateway access log and reports request count, token total, p50 and p99 latency per (route, model). It skips users on a 1,000-entry blocklist and requests that did not return 200. The log has one million seeded, synthetic lines (119 MB), one per request:
1
ts=2026-11-03T00:00:00Z level=INFO route=/v1/tokenize model=mistral-7b user=u08617 tokens=1173 latency_ms=205 status=200
The first version is the code most of us write on a first pass. It is correct, idiomatic and has no unsafe:
1
2
3
4
5
6
7
8
9
10
11
12
13
14
15
16
17
18
19
20
21
22
23
24
fn parse_fields_v0(line: &str) -> HashMap<String, String> {
    line.split(' ')
        .filter_map(|kv| kv.split_once('='))
        .map(|(k, v)| (k.to_string(), v.to_string()))
        .collect()
}

fn is_blocked_v0(blocked: &[String], user: &str) -> bool {
    blocked.iter().any(|b| b == user)
}

fn run_v0(text: &str, blocked: &[String]) -> Report {
    let mut groups: HashMap<String, Agg> = HashMap::new();
    for line in text.lines() {
        let f = parse_fields_v0(line);
        if is_blocked_v0(blocked, &f["user"]) { /* count, skip */ continue; }
        if f["status"] != "200" { /* count, skip */ continue; }
        let key = format!("{} {}", f["route"], f["model"]);
        let a = groups.entry(key).or_default();
        a.lat.push(f["latency_ms"].parse().unwrap());
        a.tokens += f["tokens"].parse::<u64>().unwrap();
    }
    finish(groups.into_iter(), nblocked, errors)
}
The repository holds five versions in one binary (logstat run v0..v4 <file>), and each version changes one thing. All five print the same report and the same checksum (d654a56473e13295) on every run, so no speed-up below comes from doing less work.
Test machine: Apple M2 Pro (12 cores), macOS 27.0.1, rustc 1.95.0, cargo build --release. Timings are medians of five interleaved runs with no profiler attached.
Step 0: build so the profiler can read it
A release build without debug info gives a profiler function names but no line numbers. One line in Cargo.toml fixes that without changing the generated code:
1
2
[profile.release]
debug = "line-tables-only"
On Apple silicon, frame pointers are always on, so stack walking just works. On Linux x86-64, add RUSTFLAGS="-C force-frame-pointers=yes" or use perf record --call-graph dwarf, or the stacks come back truncated.
Step 1: sample the process, no sudo needed
macOS ships /usr/bin/sample. It attaches to a running process you own, takes a stack every millisecond and writes a call tree as text:
1
2
./target/release/logstat run v0 access.log 2 &
sample $! 4 1 -file v0.sample.txt     # 4 seconds, 1 ms interval
cargo flamegraph uses DTrace on macOS (which needs sudo) and perf on Linux. samply record ./target/release/logstat ... opens the Firefox Profiler instead. I did not run either for this post. Both give the same kind of data, and the reading steps below apply unchanged. sample won here because it needs no install and no root, which also makes it usable on a shared CI runner or a colleague’s laptop.
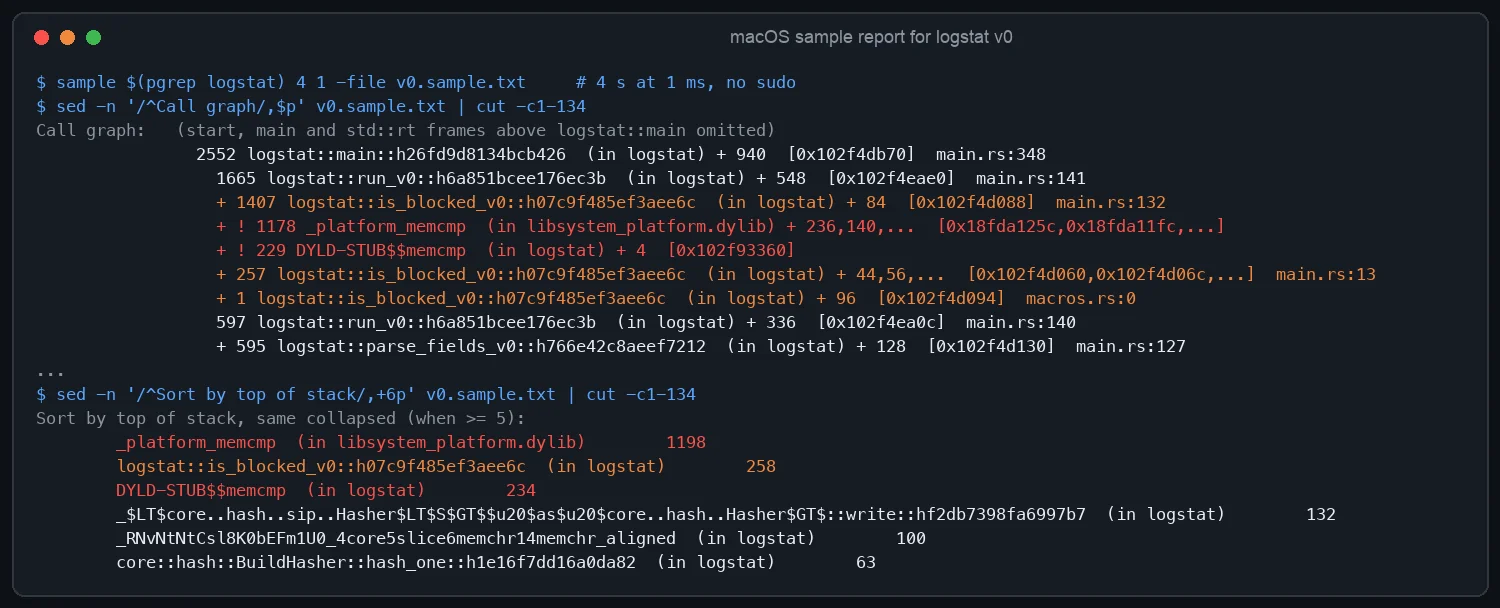
The text report already gives the answer, but call trees get hard to read past a few levels. The two small scripts next to the program turn the report into a flame graph. fold_sample.py converts sample’s indented tree into the frame;frame;frame count “folded” format that every flame graph tool reads, and demangles Rust symbols. flamegraph_svg.py draws an SVG from the folded lines, using the standard library only:
1
2
python3 scripts/rust-profiling-logstat/fold_sample.py v0.sample.txt > v0.folded
python3 scripts/rust-profiling-logstat/flamegraph_svg.py v0.folded v0.svg "logstat v0"
v0.folded also feeds inferno-flamegraph or flamegraph.pl unchanged, if you already use one of them.
Step 2: read the widest tower, not the hottest leaf
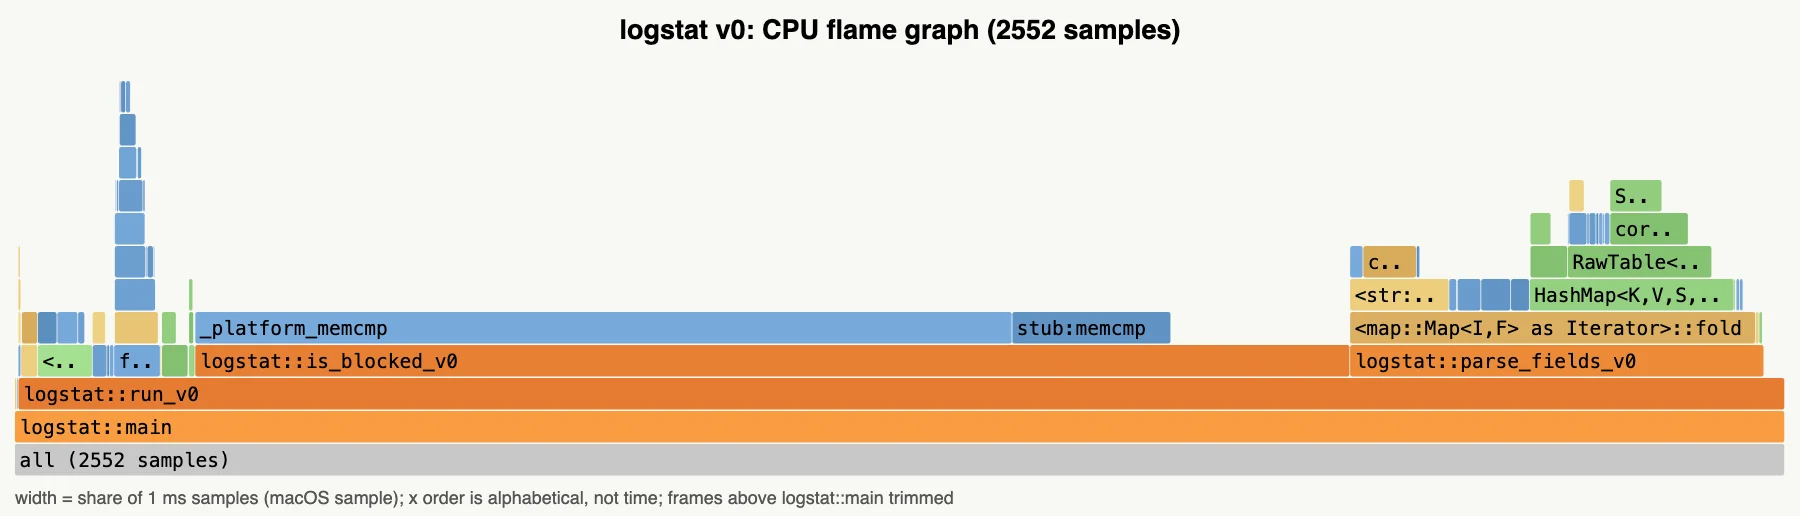
Box width is the share of samples. The x axis is alphabetical, not time. Read it bottom-up and stop at the first frame that belongs to your own code. Here that frame is is_blocked_v0 at 65.2% of samples, and 56% of all samples sit in memcmp directly above it. A self-time (“top of stack”) list would put _platform_memcmp first at 46.9%. That is true, but you cannot act on it, because nobody calls memcmp on purpose. The flame graph shows who calls it: a linear scan through 1,000 blocklisted user ids for every log line.
The fix is one type:
1
2
3
// v1: build once, O(1) lookup per line
let blocked: HashSet<&str> = list.iter().map(String::as_str).collect();
if blocked.contains(f["user"].as_str()) { /* ... */ }
v0 → v1: 3,256 ms → 1,080 ms (3.0x). Instructions retired fell from 48.9 G to 16.3 G.
Step 3: profile again, because the ranking has changed
The second profile is the step people skip, and it is the one that matters. With the scan gone, the old number-two problem is now most of the program:
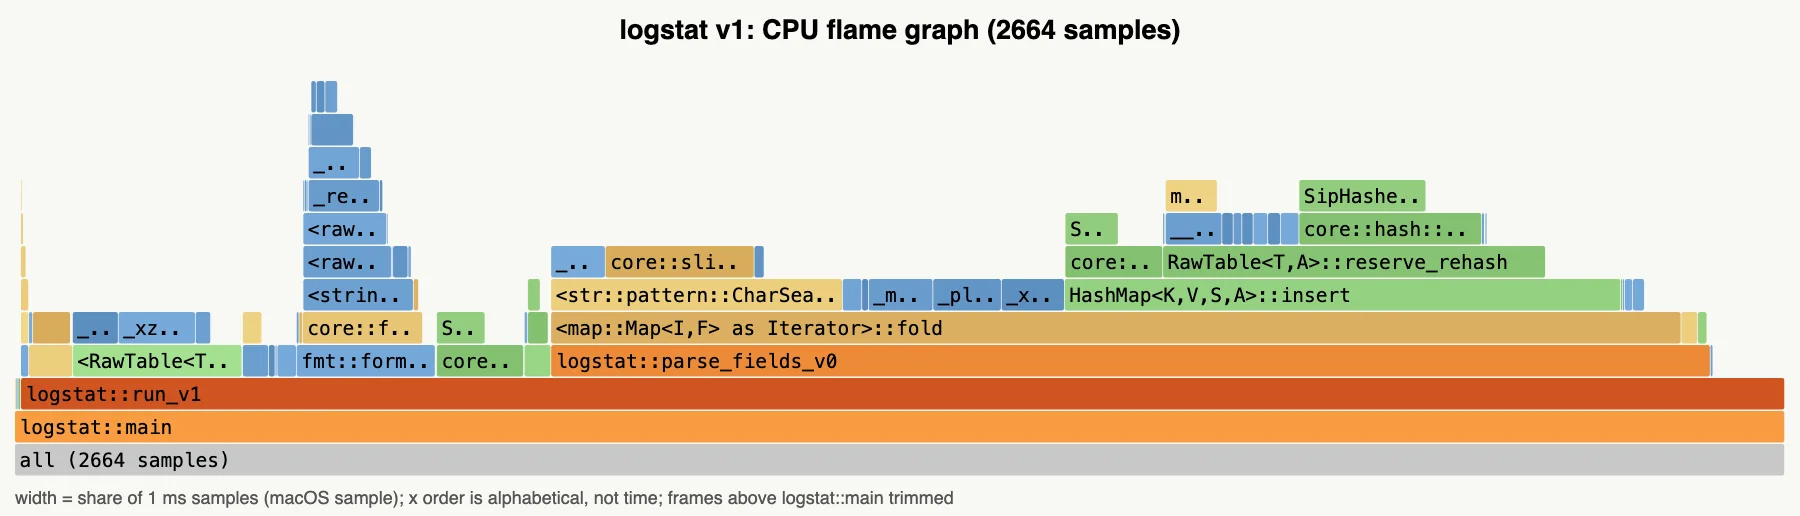
parse_fields_v0 takes 65.5% of samples. Above it, HashMap::insert takes 31.9%, reserve_rehash 21.7% (the per-line map grows as fields arrive), SipHash 13.6% of self time, and format! plus allocator frames fill most of the rest. Each line builds a fresh HashMap<String, String> to read six fields once.
A flame graph shows CPU time, not allocation counts. To check the allocator theory directly, the program has an optional counting #[global_allocator] (cargo build --release --features count-alloc):
1
2
3
4
5
6
7
unsafe impl GlobalAlloc for Counting {
    unsafe fn alloc(&self, l: Layout) -> *mut u8 {
        ALLOCS.fetch_add(1, Relaxed);
        unsafe { System.alloc(l) }
    }
    // dealloc forwards; realloc counts and forwards
}
It reports 21.5 heap allocations per log line for v0 and v1: two Strings per field, the map’s table and its regrowths, and the group key from format!. The fix is to borrow instead of own. A line struct of &str slices points into the input, and the group map is keyed on (&str, &str):
1
2
3
4
5
6
7
8
9
10
11
12
13
14
struct Line<'a> { route: &'a str, model: &'a str, user: &'a str,
                  tokens: &'a str, latency: &'a str, status: &'a str }

fn parse_fields_v2(line: &str) -> Line<'_> {
    let mut l = Line { route: "", model: "", user: "", tokens: "", latency: "", status: "" };
    for kv in line.split(' ') {
        if let Some((k, v)) = kv.split_once('=') {
            match k { "route" => l.route = v, "model" => l.model = v, "user" => l.user = v,
                      "tokens" => l.tokens = v, "latency_ms" => l.latency = v,
                      "status" => l.status = v, _ => {} }
        }
    }
    l
}
v1 → v2: 1,080 ms → 266 ms (4.1x), and 21.5 → 0.0 allocations per line. The only allocations left are the 30 group entries and their latency vectors, which round to zero per line.
Step 4: the profile names a suspect, and the measurement rejects the fix
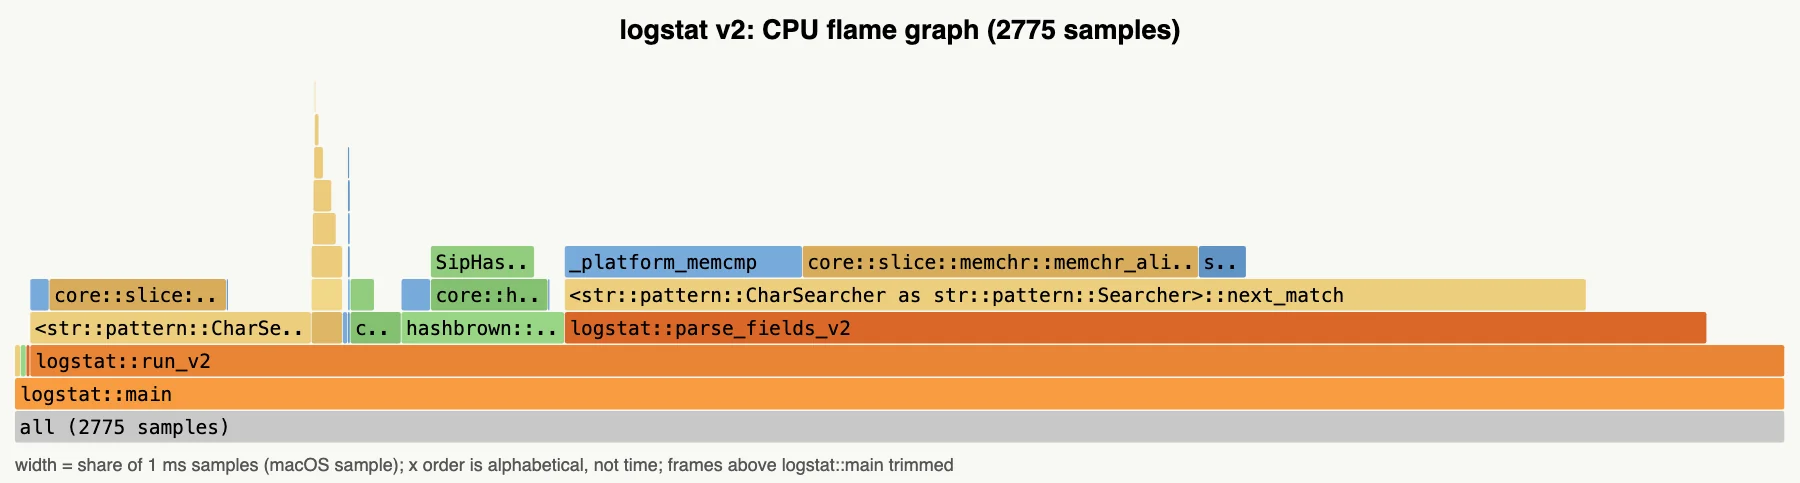
Two candidates show up in v2. String splitting (CharSearcher::next_match at 73.9% inclusive, with memchr_aligned at 32.4% self) is the larger. Hashing (hash_one with SipHash inside it, 9.5%) is the familiar one. Rust’s default SipHash-1-3 resists hash flooding, and “use FxHash” is common advice, so v3 tries exactly that: v2 with a 20-line FxHash BuildHasher.
| v2 (SipHash) | v3 (FxHash) | change | |
|---|---|---|---|
| Instructions retired (median) | 4.21 G | 4.09 G | −3% |
| Cycles (median) | 1.03 G | 1.09 G | +5% |
| Wall time (median of 5) | 266 ms | 281 ms | +6% |
FxHash runs fewer instructions and takes longer. Its profile moves time into HashMap::contains_key (7.9% self) rather than removing it. On these short, similar keys (u01234), the cheaper hash buys nothing. v3 is rejected. A profile tells you where time goes. It does not tell you whether a given replacement helps, and only a run without the profiler can answer that.
The larger suspect was splitting. split(' ') followed by split_once('=') scans every byte twice through a generic pattern searcher. v4 walks the line’s bytes once and matches the key as a byte slice:
1
2
3
4
5
6
7
8
9
10
11
12
13
14
15
16
17
18
19
20
21
22
23
fn parse_fields_v4(line: &str) -> Line<'_> {
    let mut l = Line { route: "", model: "", user: "", tokens: "", latency: "", status: "" };
    let b = line.as_bytes();
    let (mut start, mut eq) = (0, usize::MAX);
    for i in 0..=b.len() {
        let c = if i < b.len() { b[i] } else { b' ' };
        if c == b'=' && eq == usize::MAX {
            eq = i;
        } else if c == b' ' {
            if eq != usize::MAX {
                let v = &line[eq + 1..i];
                match &b[start..eq] {
                    b"route" => l.route = v, b"model" => l.model = v, b"user" => l.user = v,
                    b"tokens" => l.tokens = v, b"latency_ms" => l.latency = v,
                    b"status" => l.status = v, _ => {}
                }
            }
            start = i + 1;
            eq = usize::MAX;
        }
    }
    l
}
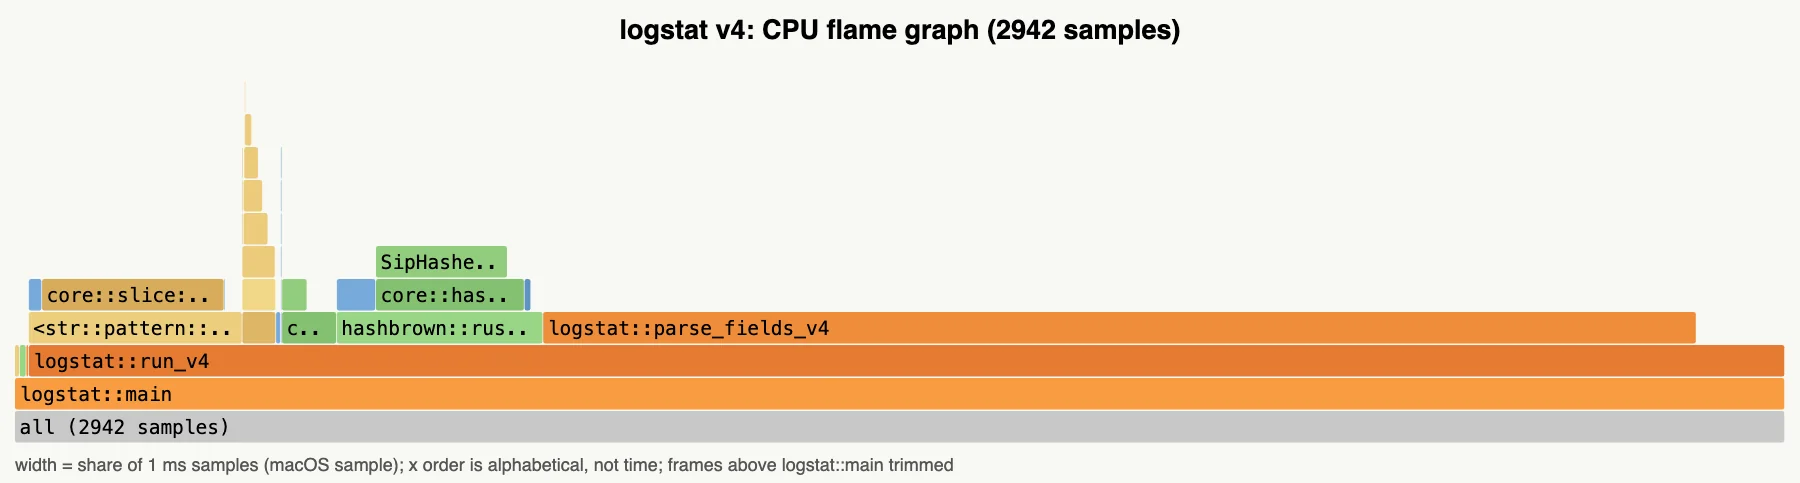
v2 → v4: 266 ms → 233 ms (12% faster, 17% fewer instructions). The v4 flame graph has the shape you want to stop at. The widest box, parse_fields_v4 at 65.3%, is flat with almost nothing above it, so the time goes to the one loop that has to touch every byte. Only the reading of 119 MB of input is left to remove. A further gain would need a different design, such as parallel chunks or memchr-based field jumps, not another local fix.
Results
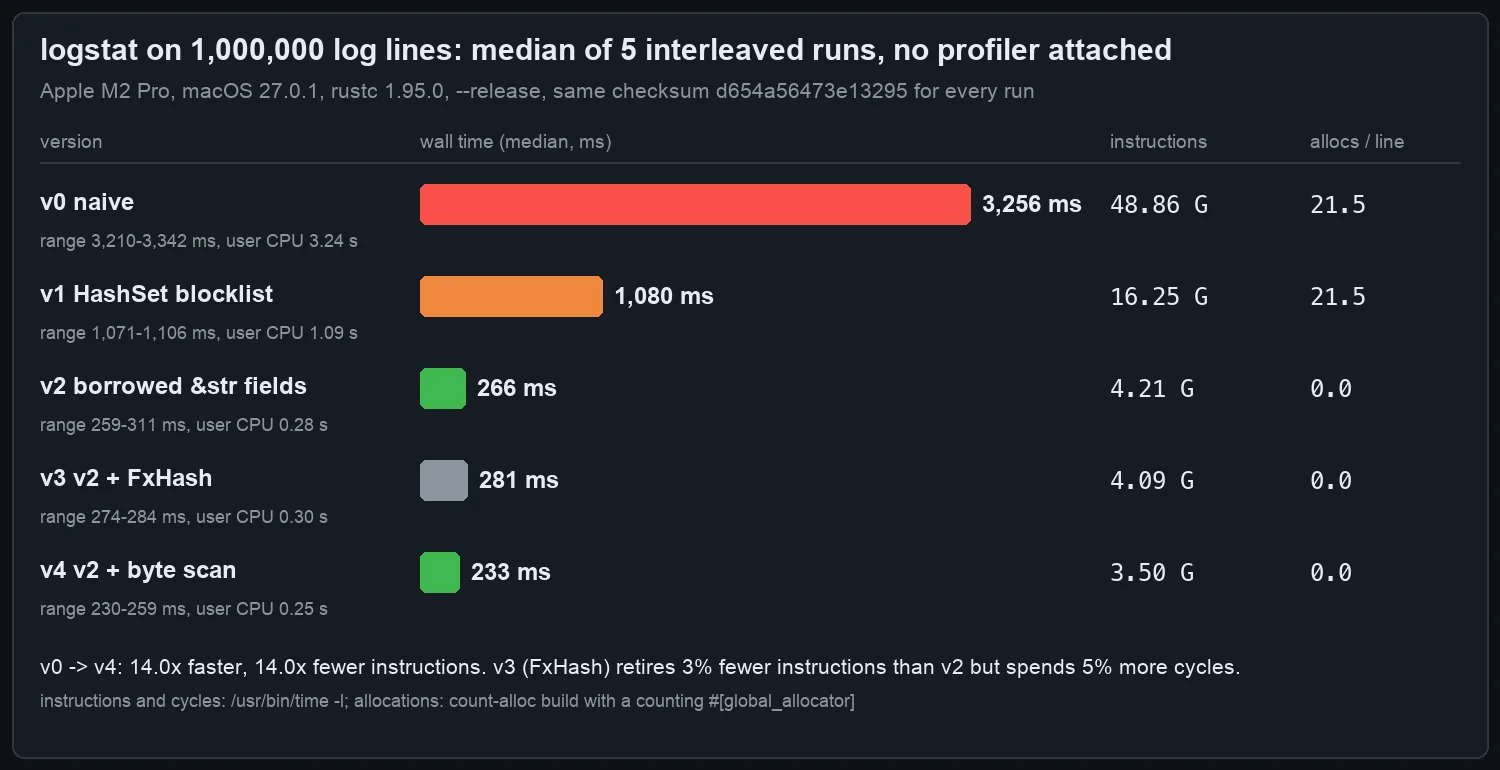
| Version | Change | Wall time (median, range) | Instructions | Allocs / line | Widest own frame in its profile |
|---|---|---|---|---|---|
| v0 | naive | 3,256 ms (3,210–3,342) | 48.86 G | 21.5 | is_blocked_v0 65.2% |
| v1 | HashSet blocklist | 1,080 ms (1,071–1,106) | 16.25 G | 21.5 | parse_fields_v0 65.5% |
| v2 | borrowed &str fields | 266 ms (259–311) | 4.21 G | 0.0 | parse_fields_v2 64.8% |
| v3 | v2 + FxHash (rejected) | 281 ms (274–284) | 4.09 G | 0.0 | parse_fields_v2 61.6% |
| v4 | v2 + byte scan | 233 ms (230–259) | 3.50 G | 0.0 | parse_fields_v4 65.3% (flat) |
Peak RSS stayed at about 121 MB for every version, because the 119 MB input is read into memory whole. Two notes on method:
- Count instructions as well as time. The test Mac was shared with other jobs, with a load average between 7 and 20 during the runs, and single wall-time runs moved by up to 3x. Instructions retired from
/usr/bin/time -lvaried by under 0.6% between runs. Use them to check that a change did what you think, then confirm with wall time. - Never time with the profiler attached. Sampling at 1 ms costs CPU, and 2.5% of v3’s samples (
???) were stacks the sampler could not unwind.
Reproduce it
Everything is in this blog’s repository under scripts/rust-profiling-logstat/:
1
2
3
bash scripts/rust-profiling-logstat/measure.sh logstat-work          # ~1 min: build, 1M-line log, 25 timed runs, 5 profiles
python3 scripts/rust-profiling-logstat/summarise.py logstat-work     # -> scripts/data/rust-profiling-logstat-m2pro.json
python3 scripts/gen_rust_profiling_guide_images.py logstat-work      # every image on this page
The log generator is seeded, so you get the same one million lines and the same checksum. Your timings will differ, but the profile shapes and the ranking should not.
Takeaways
- Read the widest frame of your own code, not the hottest leaf.
memcmptopped the self-time list, butis_blocked_v0was the line to change. - Re-profile after every fix. The v1 problem (21.5 allocations per line) was a minor cost in v0’s profile.
- Use a counting allocator to answer allocation questions. A flame graph shows time, so check allocation counts with an allocator that counts them.
- The profiler finds the suspect, and an unprofiled run convicts it. FxHash looked like an obvious win and lost 6%.
- Stop when the flame graph is flat. When the widest box is your core loop with nothing above it, local tuning is done.
We use this profile → change one thing → re-measure loop on the Rust services behind Lamplit Labs’ products. Measuring a change against a baseline before accepting it is also at the core of Pulse, Lamplit Labs’ self-improving automation product, coming soon.
Related reading
- Profiling a Rust LLM Token Batcher with cargo flamegraph: the same loop on a Linux service with
cargo flamegraphandSmallVec. - Go pprof Profiling Guide: CPU, Goroutine and Mutex Profiles: the Go version of this guide.
- Rust mimalloc vs glibc malloc: for when the allocations cannot be removed.
- Rust Release Profiles: LTO, codegen-units and target-cpu: build settings to try once the code is right.
- Profiling an ASP.NET Core endpoint with dotnet-trace and dotnet-counters: the same workflow in .NET.
- Pulse: Lamplit Labs’ self-improving automation product, coming soon: the product mentioned above.