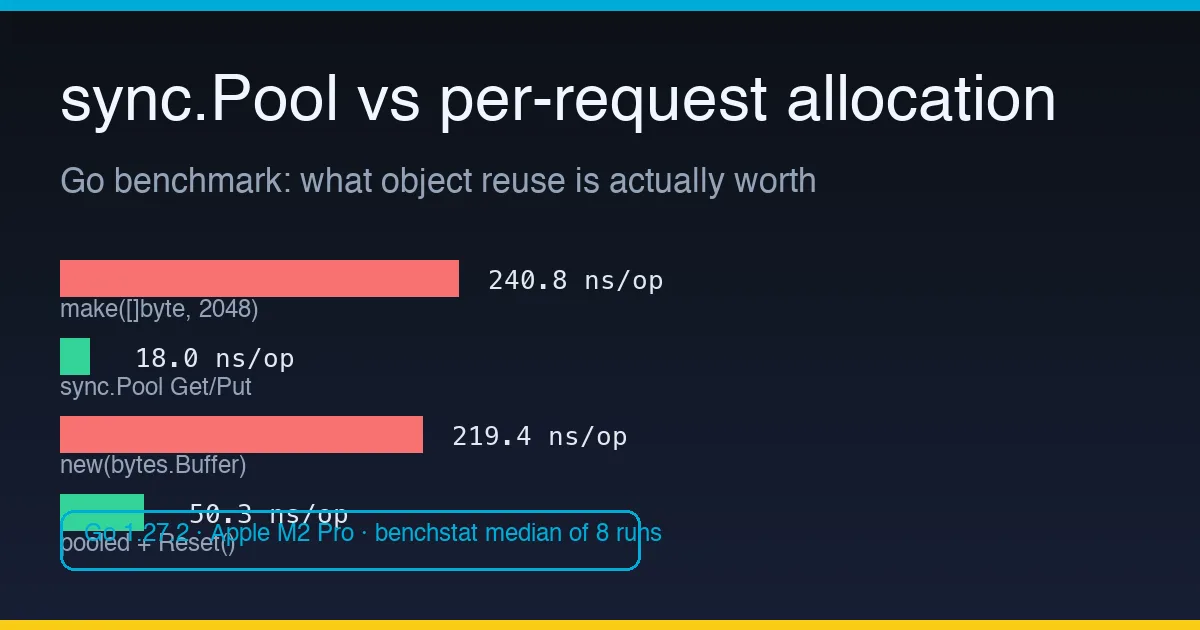
Go Performance: sync.Pool vs Per-Request Allocation, Benchmarked
Go 1.27 benchmarks of sync.Pool versus per-request allocation: a 2 KiB scratch buffer drops from 240 ns to 18 ns per op, plus the cases where pooling hurts.
Go 1.27 benchmarks of sync.Pool versus per-request allocation: a 2 KiB scratch buffer drops from 240 ns to 18 ns per op, plus the cases where pooling hurts.
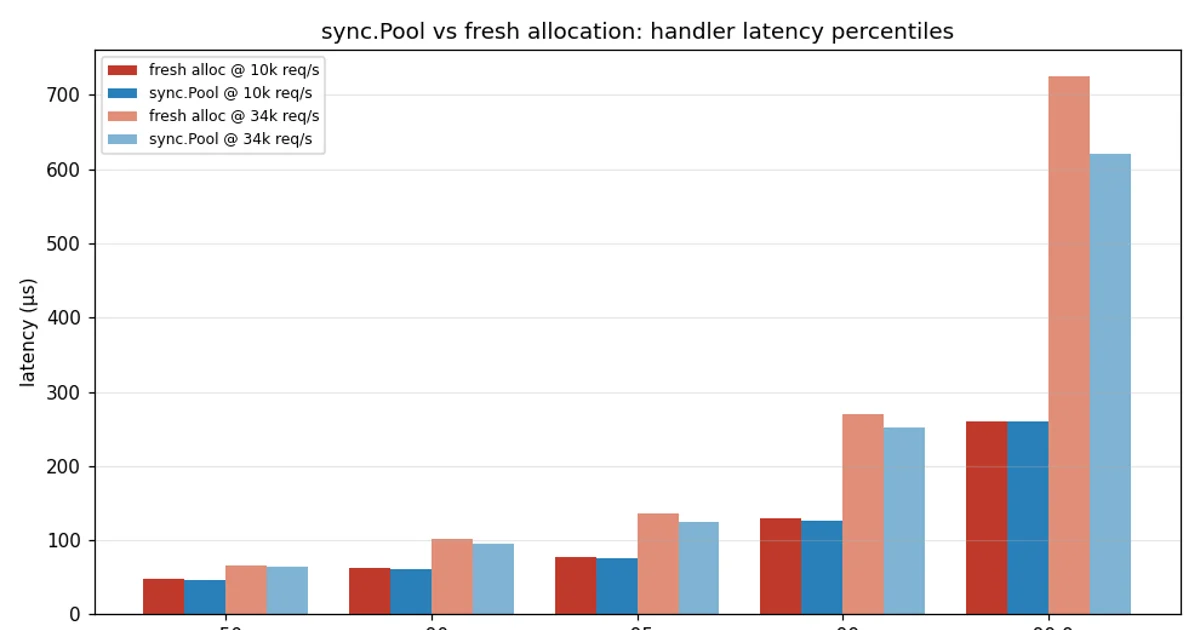
The microbenchmark said sync.Pool was 13x faster per op. We pointed a load generator at a real net/http handler to see if p99 actually moves.
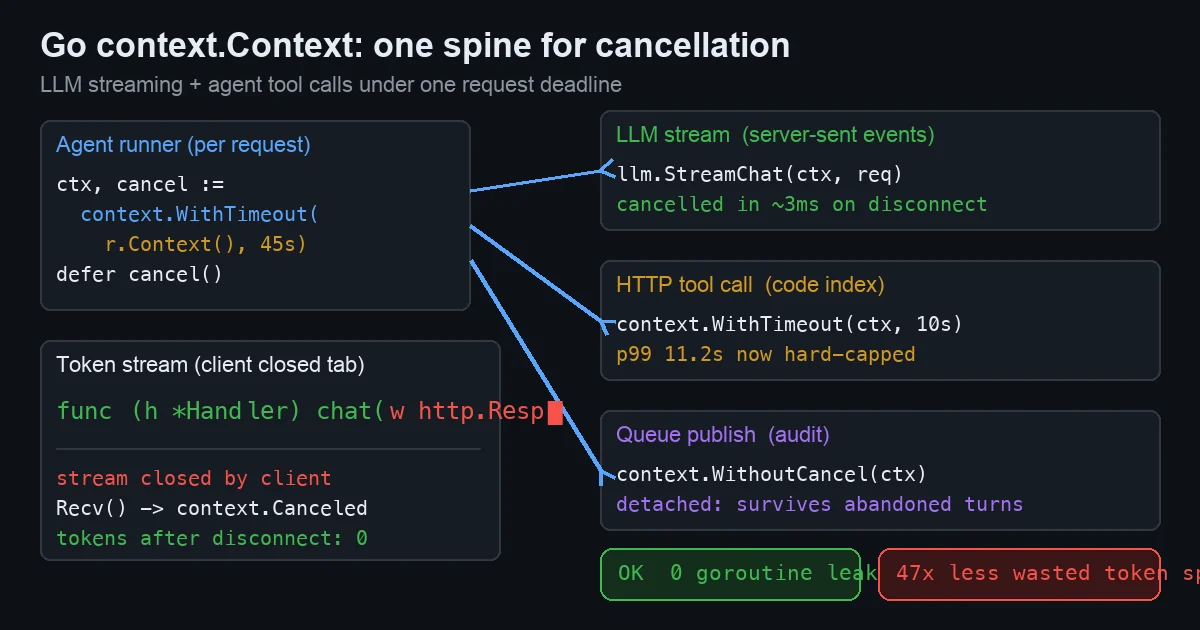
Go context.Context deadlines and cancellation for LLM token streaming and agent tool calls: four leak patterns, fixes, and measured savings.
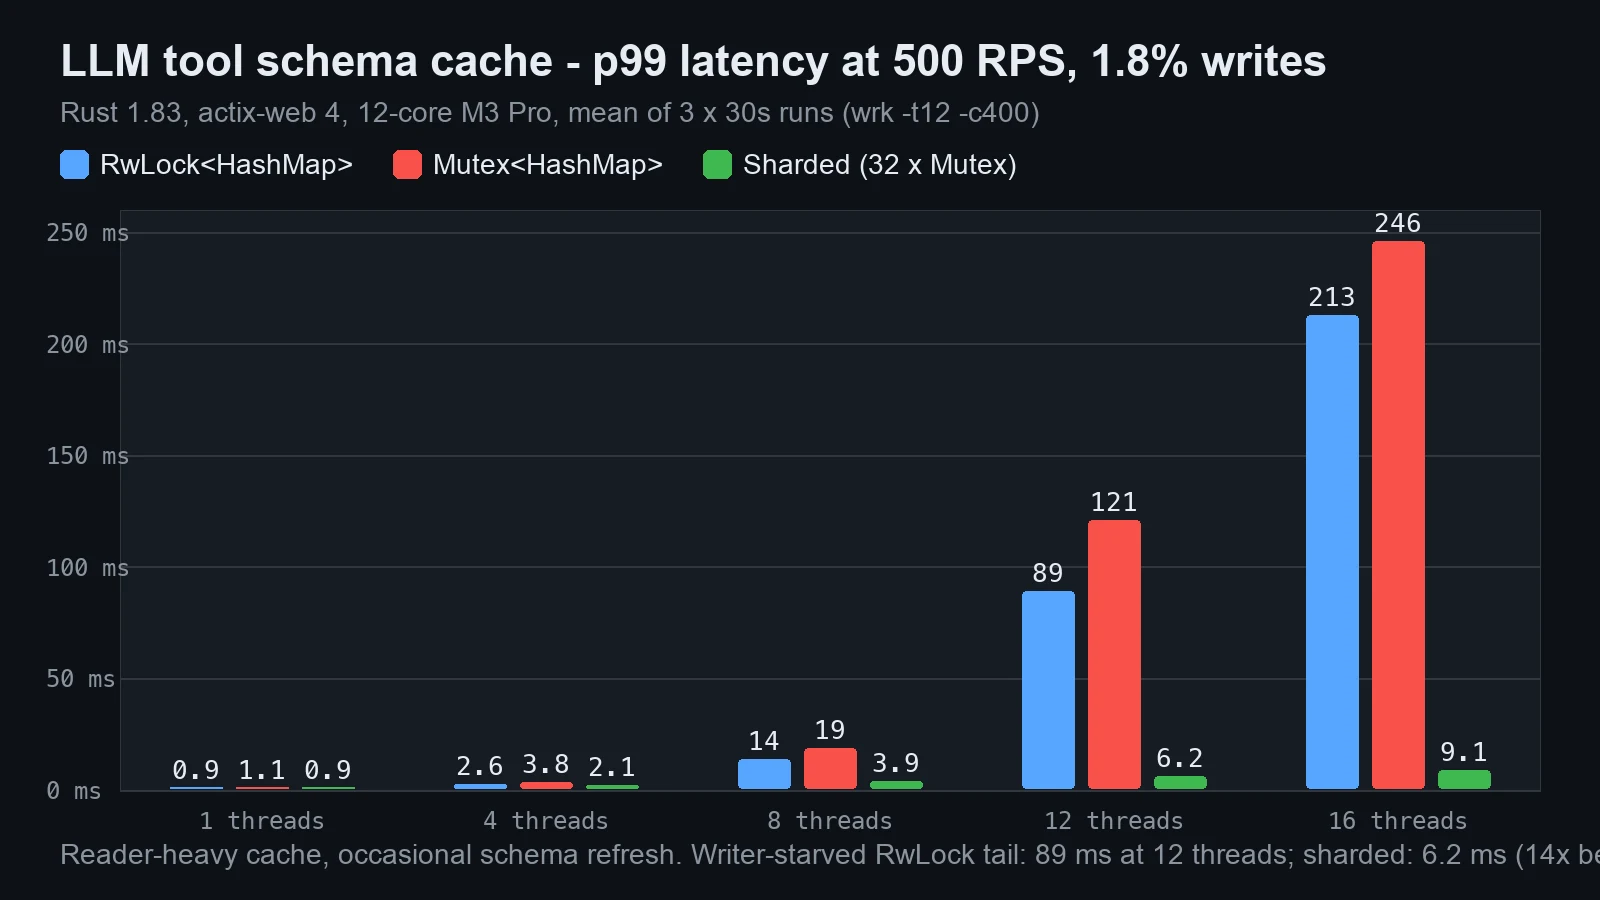
One RwLock behind our Rust LLM gateway pushed p99 to 89 ms at 12 threads; 32 sharded Mutexes cut the tail 14x. Benchmarks, charts, and the fix.
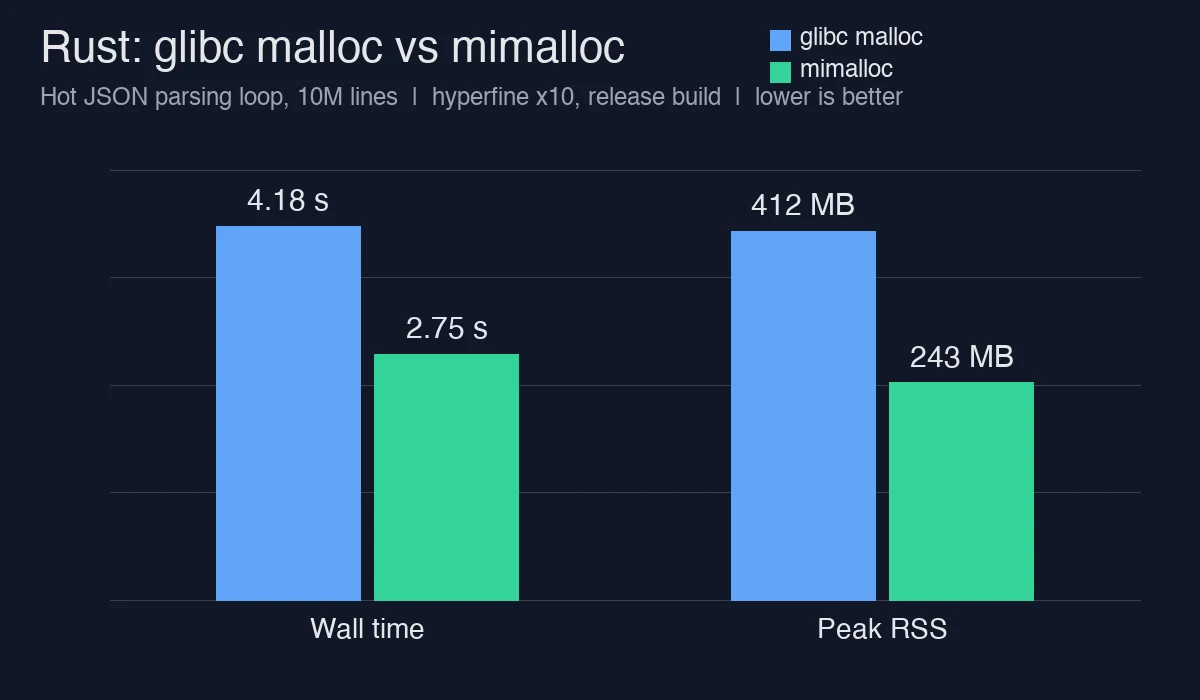
One line - swapping Rust's global allocator to mimalloc - cut a hot parse loop's runtime 34% and RSS 41% on glibc. Measured with hyperfine, with chart.
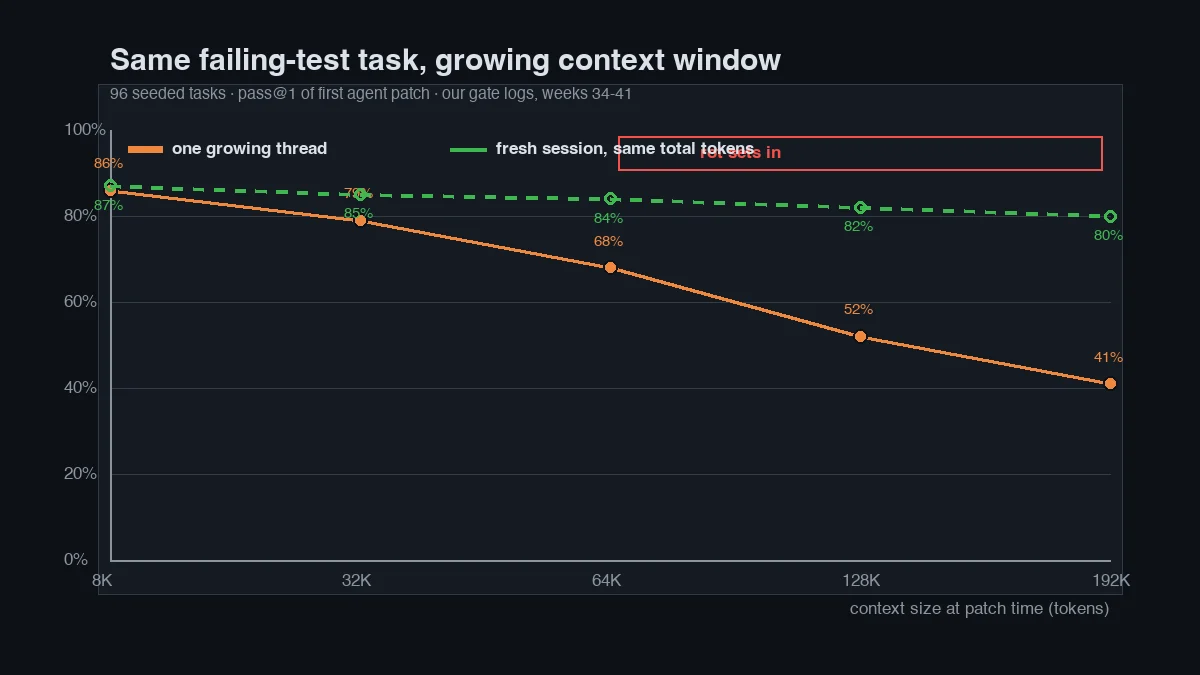
Gate logs from 96 seeded coding tasks: one growing agent thread loses 45 pass@1 points by 192K tokens while fresh sessions hold 80%.
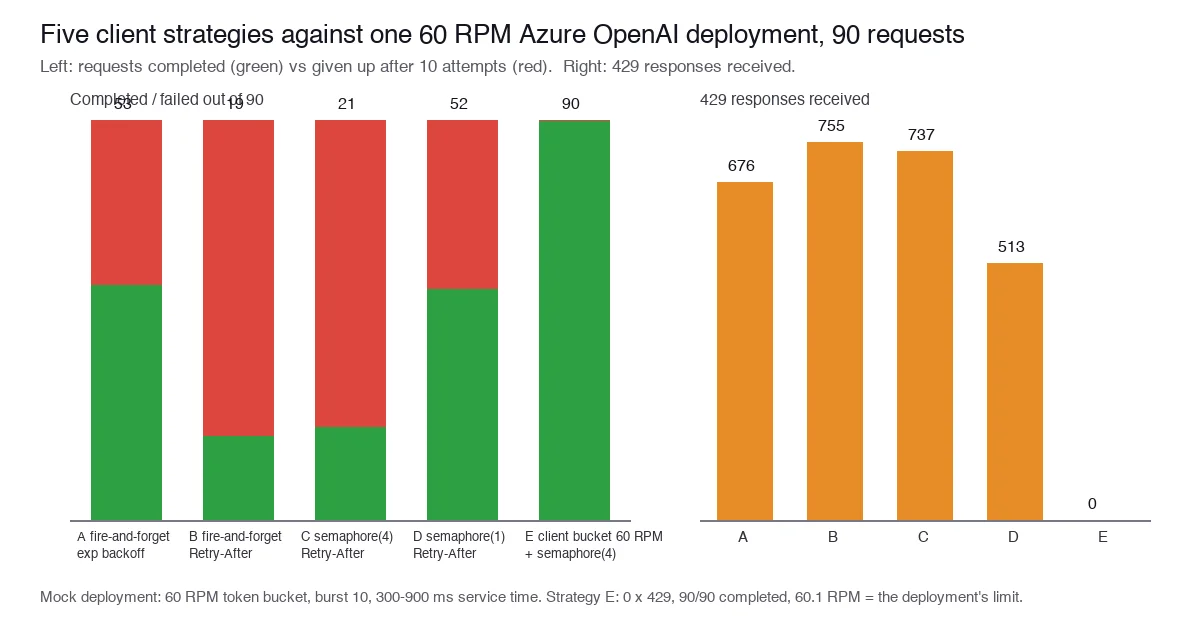
90 requests vs a 60 RPM Azure OpenAI deployment, five client strategies: retries lose 40-80% of calls, a client-side token bucket finishes 90/90 with zero 429s.
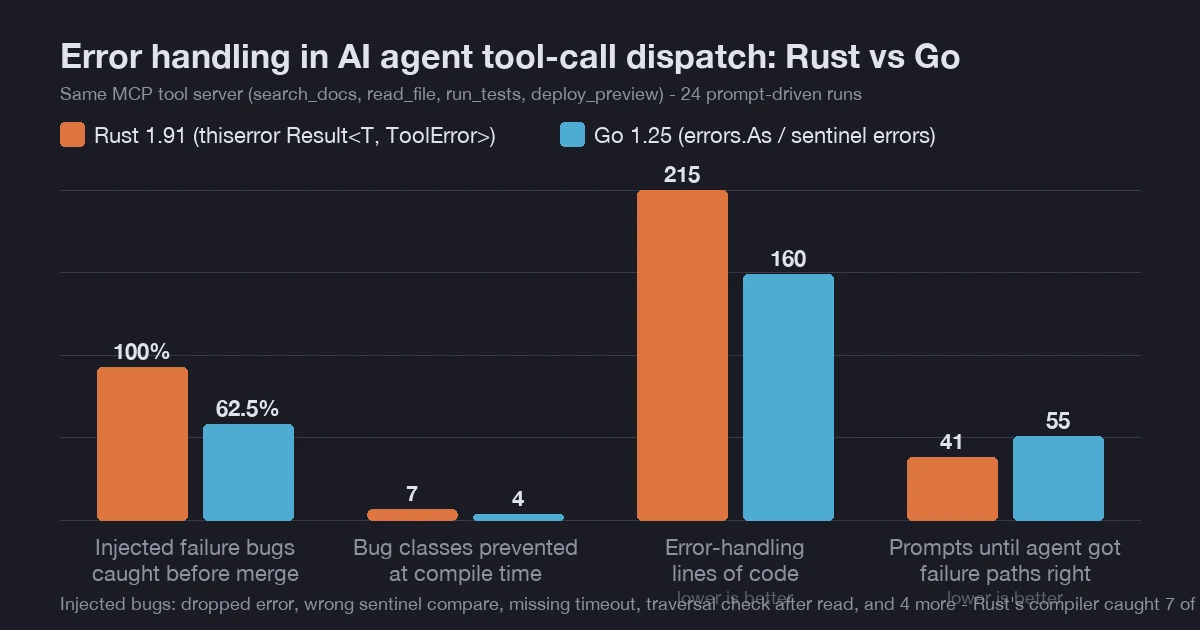
Rust Result enums vs Go multi-return errors in the same MCP tool-call dispatch layer: four failure classes, 24 runs, and which bugs each caught.
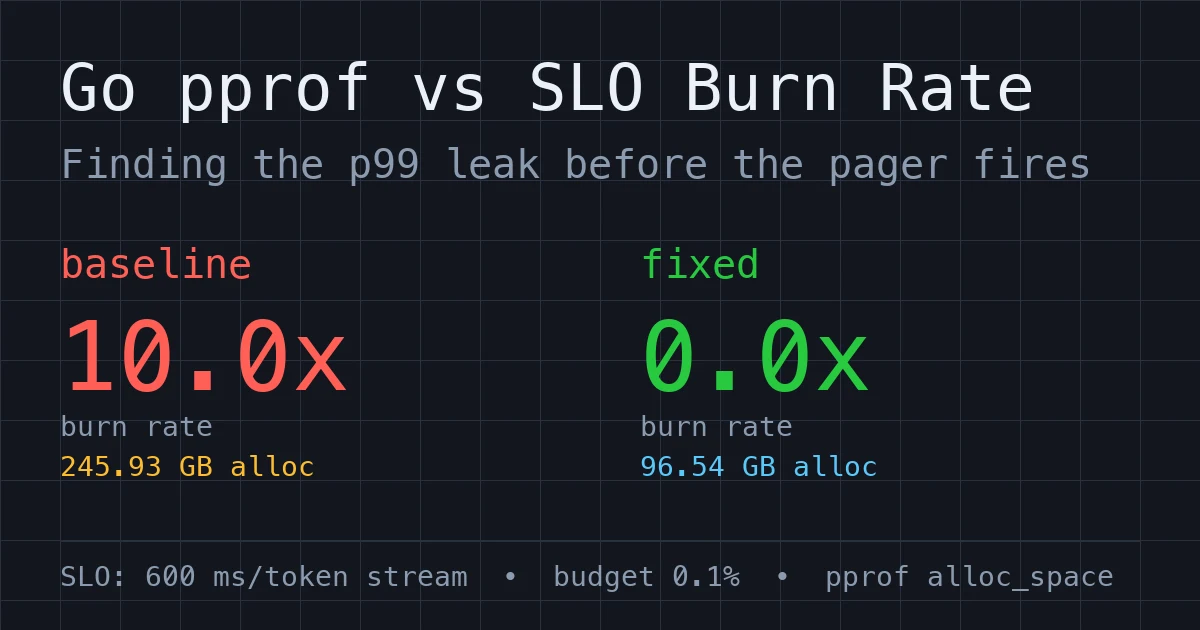
A 10x SLO burn rate in our Go LLM gateway traced to one regex-and-concat SSE parser. pprof alloc_space showed 245 GB of garbage in 25 s.
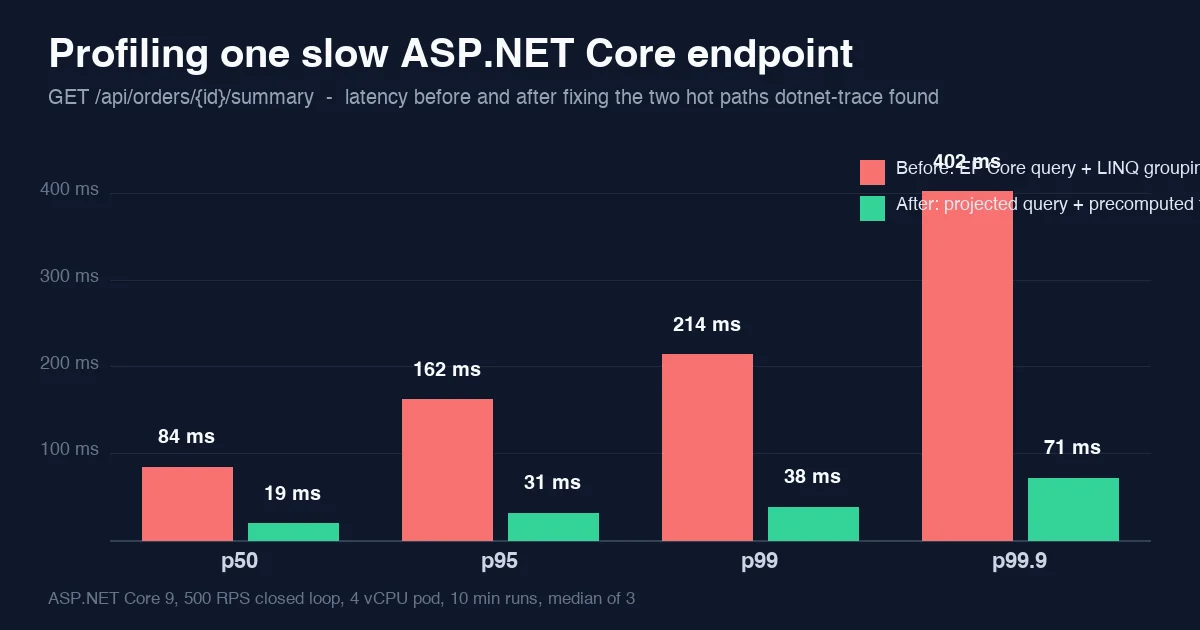
Profiling a 214 ms p99 ASP.NET Core endpoint with dotnet-counters and dotnet-trace: 2.9 MB allocated per request, one GroupBy to blame, p99 down to 38 ms.