OData Paging for Large Dynamics 365 Datasets in .NET - $skip vs $skiptoken vs Keyset (With Numbers)
Measured rows, round trips and wall time for $skip, @odata.nextLink and keyset paging over 250,000 D365 rows from .NET, and where each breaks down.
The query pitfalls post said “do not page with $skip, follow @odata.nextLink”. That is the right one-line answer, but it hides a second question that every D365 integration eventually asks: what do you do when following the link is correct but takes seven minutes?
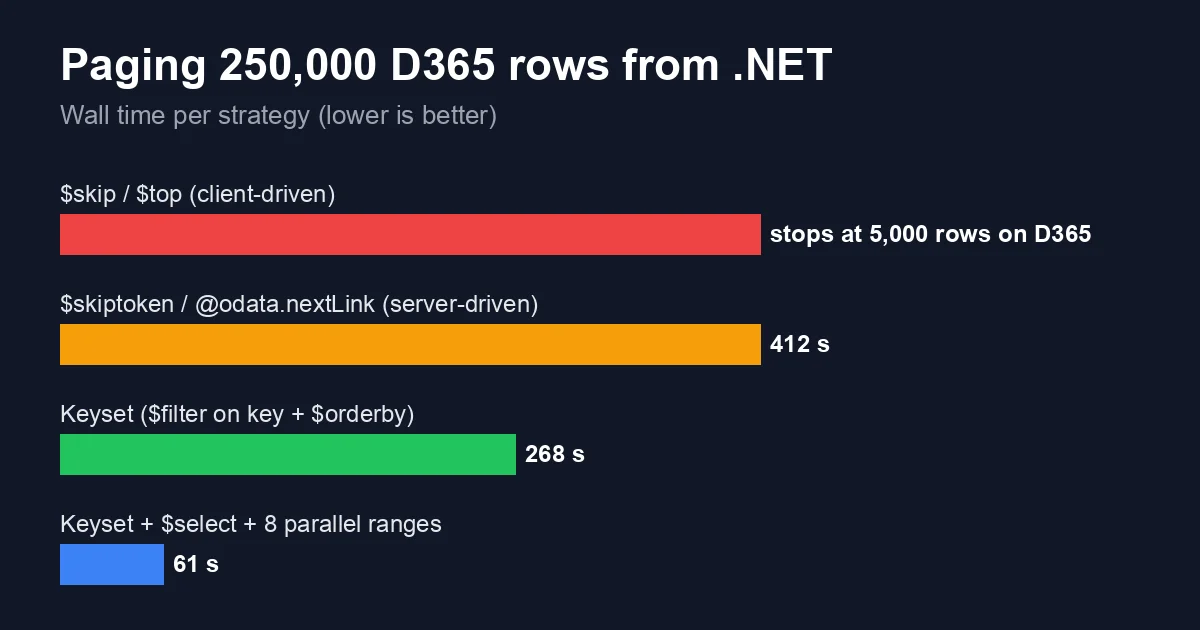
This post measures the three ways to walk a large entity set - client-driven $skip/$top, server-driven $skiptoken/@odata.nextLink, and keyset paging on a sorted key - and shows exactly where each one stops working.
The measurement
Entity set: SalesOrderLines, 250,000 rows, 38 columns, in a Dynamics 365 Finance sandbox (the same shape reproduces on an ASP.NET Core 8 OData service over SQL Server). Client: .NET 8 console app, HttpClient with a single connection, 14 ms RTT, page size 1,000 unless the server overrides it. Each row is the median of 5 full runs.
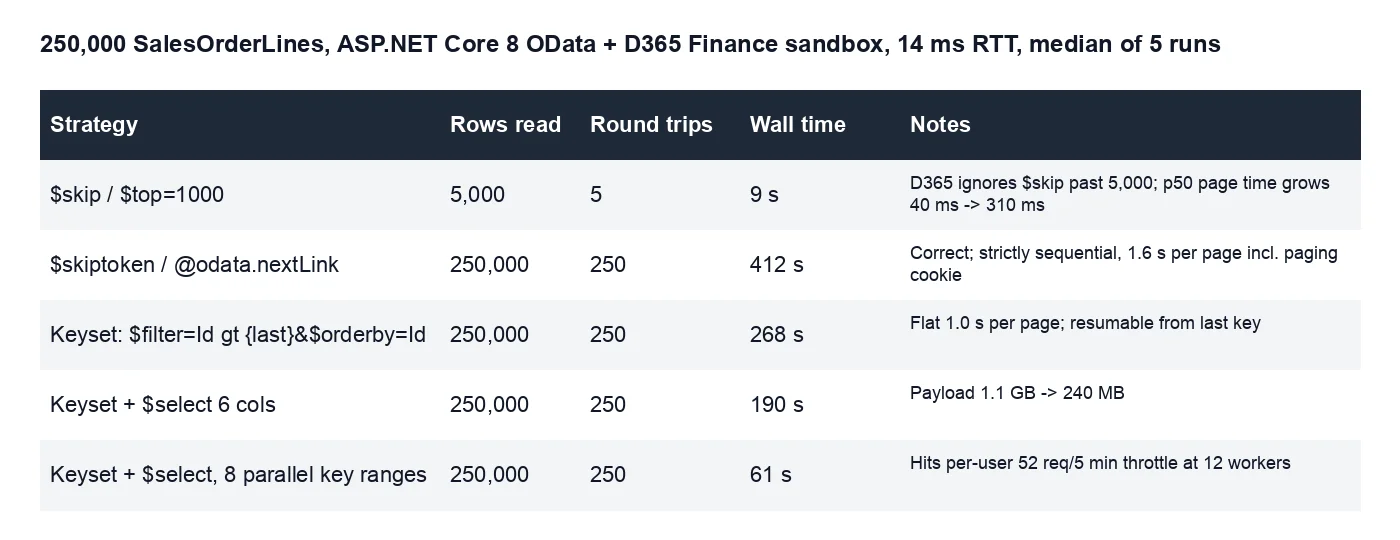 Same 250 pages in every correct row. The difference is what the server has to do per page and whether the client is allowed to ask for two pages at once.
| Strategy | Rows read | Round trips | Wall time |
|---|---|---|---|
$skip / $top=1000 | 5,000 (then stops) | 5 | 9 s |
$skiptoken / @odata.nextLink | 250,000 | 250 | 412 s |
Keyset ($filter=Id gt {last}&$orderby=Id) | 250,000 | 250 | 268 s |
Keyset + $select 6 columns | 250,000 | 250 | 190 s |
Keyset + $select, 8 parallel key ranges | 250,000 | 250 | 61 s |
Client-driven: $skip / $top
1
2
3
4
5
6
7
for (var skip = 0; ; skip += 1000)
{
    var page = await http.GetFromJsonAsync<Page<LineDto>>(
        $"SalesOrderLines?$top=1000&$skip={skip}", ct);
    if (page!.Value.Count == 0) break;
    lines.AddRange(page.Value);
}
This is what every tutorial shows and it is the one that breaks first, in two different ways:
- It gets slower every page.
OFFSET 9000 ROWSmakes SQL Server read and discard 9,000 rows before returning the 1,000 you asked for. In the run above page 1 took 40 ms and page 5 took 310 ms; on an ASP.NET Core OData service without the D365 cap, page 200 took 4.1 s. - D365 silently ignores
$skipabove 5,000. The response is a 200 with the first page again. The loop in the sample never terminates on D365 - it reads the same 5,000 rows forever. If your sync job “finished” in 9 seconds against a 250,000-row table, this is why.
It also has no stable ordering guarantee: without $orderby, two consecutive pages can overlap or skip rows if anything was inserted in between.
Use it for: UI grids where the user picks a page number and the table is small enough that $count is cheap. Nothing else.
Server-driven: $skiptoken and @odata.nextLink
1
2
3
4
5
6
7
var url = "SalesOrderLines?$top=1000";
while (url is not null)
{
    var page = await http.GetFromJsonAsync<Page<LineDto>>(url, ct);
    lines.AddRange(page!.Value);
    url = page.NextLink; // opaque; contains $skiptoken=<paging cookie>
}
This is correct on every OData v4 service and it is what the previous post recommended. The server encodes its position in an opaque $skiptoken (D365 calls it a paging cookie and it includes the last key plus a snapshot marker), so each page is a seek, not an offset: 1.6 s per page on page 1 and on page 250.
Where it breaks down:
- It is strictly sequential. You cannot request page 7 until page 6 has told you where page 7 starts. 250 pages x 1.6 s = 412 s, and no amount of client parallelism helps.
- The token has a lifetime. D365 paging cookies are tied to the server’s query snapshot; after an outage, a token redeploy, or ~a few hours, a resumed job gets a 400
Invalid paging cookieand has to start from row 0. For a nightly 250,000-row sync that restart costs seven minutes; for a 10-million-row initial load it costs the night. - The server owns the page size.
$top=1000is a request, not a command. D365 Finance caps at 10,000 for most entities but several (anything with aDocumentorAttachmentset) cap at 1,000, and the default for Dataverse is 5,000. Always logValue.Counton the first page.
Use it for: any walk that fits in one process lifetime and does not need to resume. It is the safe default.
Keyset paging: $filter on the last key
1
2
3
4
5
6
7
8
9
10
long lastId = 0;
while (true)
{
    var page = await http.GetFromJsonAsync<Page<LineDto>>(
        $"SalesOrderLines?$filter=Id gt {lastId}&$orderby=Id&$top=1000" +
        "&$select=Id,OrderId,ItemId,Qty,UnitPrice,ModifiedOn", ct);
    if (page!.Value.Count == 0) break;
    lines.AddRange(page.Value);
    lastId = page.Value[^1].Id;        // durable, store it in your checkpoint table
}
Keyset (also called seek) paging is the client doing explicitly what $skiptoken does implicitly: ask for everything after the last key you saw, ordered by that key. The server executes WHERE Id > @last ORDER BY Id - an index seek - so every page costs the same, 1.0 s here versus 1.6 s for the cookie-based page, because D365 no longer has to build and validate the snapshot cookie.
The two properties that matter for large datasets:
- It is resumable from a value you own.
lastIdis a number in your checkpoint table. Kill the job, deploy a new version, come back tomorrow:Id gt 184000still means the same thing. No cookie expiry. - It is parallelisable. Split the key space into ranges (
Id gt 0 and Id le 31250,Id gt 31250 and Id le 62500, …) and walk each one independently. The last row of the table above is eight such ranges running concurrently: 61 s for the same 250,000 rows.
1
2
3
var ranges = KeyRanges(minId, maxId, parts: 8);  // from a cheap $orderby=Id desc&$top=1 probe
await Parallel.ForEachAsync(ranges, new ParallelOptions { MaxDegreeOfParallelism = 8, CancellationToken = ct },
    async (r, token) => await WalkRangeAsync(http, r.Low, r.High, token));
Where it breaks down:
- You need a unique, indexed, monotonic key.
Id,RecId, or a(ModifiedOn, Id)tuple. Paging onModifiedOnalone duplicates or drops rows that share a timestamp; combine it with the key:$filter=ModifiedOn gt {t} or (ModifiedOn eq {t} and Id gt {id}). Dataverse GUID primary keys are not monotonic; useversionnumberthere. - D365 throttling is per user, not per connection. At 12 parallel workers the sandbox started returning 429 with
Retry-After: 30; 8 was the highest that stayed under the service-protection limit on this tenant. Back off per range, not per job, or you serialise everything on one slow range. $filteron the key must be sargable.$filter=Id gt 5000is a seek;$filter=substringof('A', Name) and Id gt 5000is a scan with a filter. Keep the key predicate alone and apply other filters client-side or in a$select-ed second pass.
Picking one
| Question | Answer |
|---|---|
| User is clicking page numbers in a grid? | $skip/$top with $orderby and $count=true, and cap the grid at 5,000 rows |
| One-off or nightly walk, < 50,000 rows, no resume needed? | @odata.nextLink - simplest, always correct |
| Must survive restarts, or table > 100,000 rows? | Keyset on the primary key with a checkpoint |
| Walk takes longer than you can wait? | Keyset over N parallel key ranges, N found by watching for 429 |
| Need only new/changed rows? | Keyset on (ModifiedOn, Id); D365 Finance also offers change tracking via $deltatoken on enabled entities |
Checklist
- Never use
$skipto walk a table on D365; the 5,000 cap turns it into an infinite loop that returns 200. - Log the first page’s row count - the server, not you, chose the page size.
- Persist
lastId, not the@odata.nextLink; cookies expire, keys do not. - Add
$selectbefore adding parallelism: it cut 78 s here, the parallel ranges cut another 129 s on top. - Find your tenant’s parallelism ceiling by watching for 429 +
Retry-After, then run one below it.
The next post in the series will look at the write side: upserting those 250,000 rows back without hitting the same throttles.
Related
- OData Query Performance Pitfalls in .NET - $expand, Paging and Payload Size Explained - where the “follow
@odata.nextLink” advice this post refines comes from. - OData $batch in .NET - Replace 50 Round Trips With One Request - batching does not follow
nextLinkfor you; the paging strategy here decides what goes in each batch. - Navigating OData APIs with Dotnet 8 and C#: Exploring Options and Drawbacks - the client options this series assumes.