Embedding Visualizer: Checking Vector Similarity Before You Trust Retrieval
How the Lamplit Labs Embedding Visualizer compares two vectors with cosine, dot product and Euclidean distance to debug RAG thresholds and mismatches.
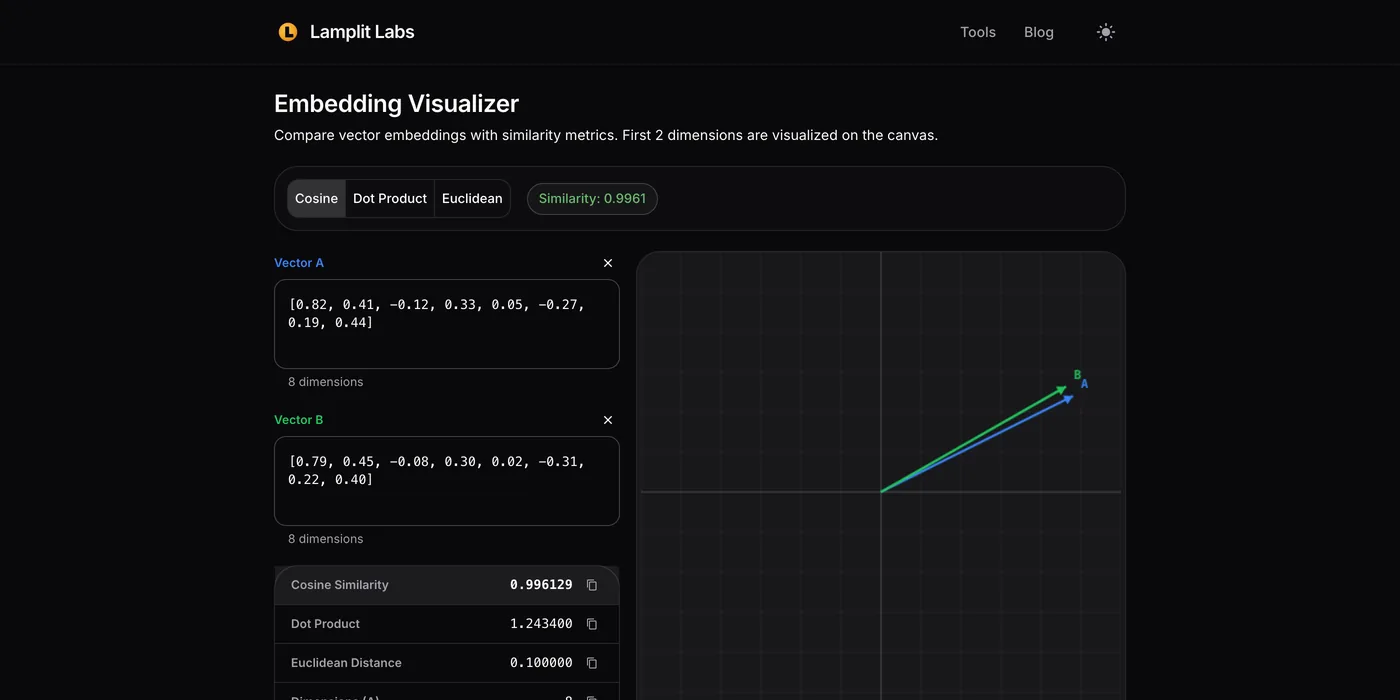
The Text Chunker post ended where most RAG pipelines start getting opaque: once the chunks are embedded, everything that happens next is arithmetic on vectors you never look at. A retrieval bug shows up as “the wrong passage came back”, and the only evidence is a float somewhere between -1 and 1. The Embedding Visualizer on the Lamplit Labs tools site is for the moment you need to look at two of those vectors and know what the number between them actually is. It runs entirely in the browser; the vectors never leave the tab.
What the page looks like
Two text areas, Vector A and Vector B, each accepting either a JSON array ([0.1, 0.2, 0.3]) or plain space- or comma-separated numbers, which is what you get when you copy a row out of a notebook or a database shell. Below each box the tool reports how many dimensions it parsed, so a stray trailing comma or a truncated paste is visible before you read any score.
Above the result are three tabs, Cosine Similarity, Dot Product and Euclidean Distance, and the result card shows the chosen metric along with the magnitude of each vector. A small canvas plots the first two dimensions of both vectors as arrows from the origin; it is a sketch, not a projection, but it is enough to see at a glance whether two vectors point the same way.
Here is the page with two eight-dimensional vectors that differ by a few hundredths in each position, the kind of pair you get from embedding a sentence and a lightly edited copy of it:
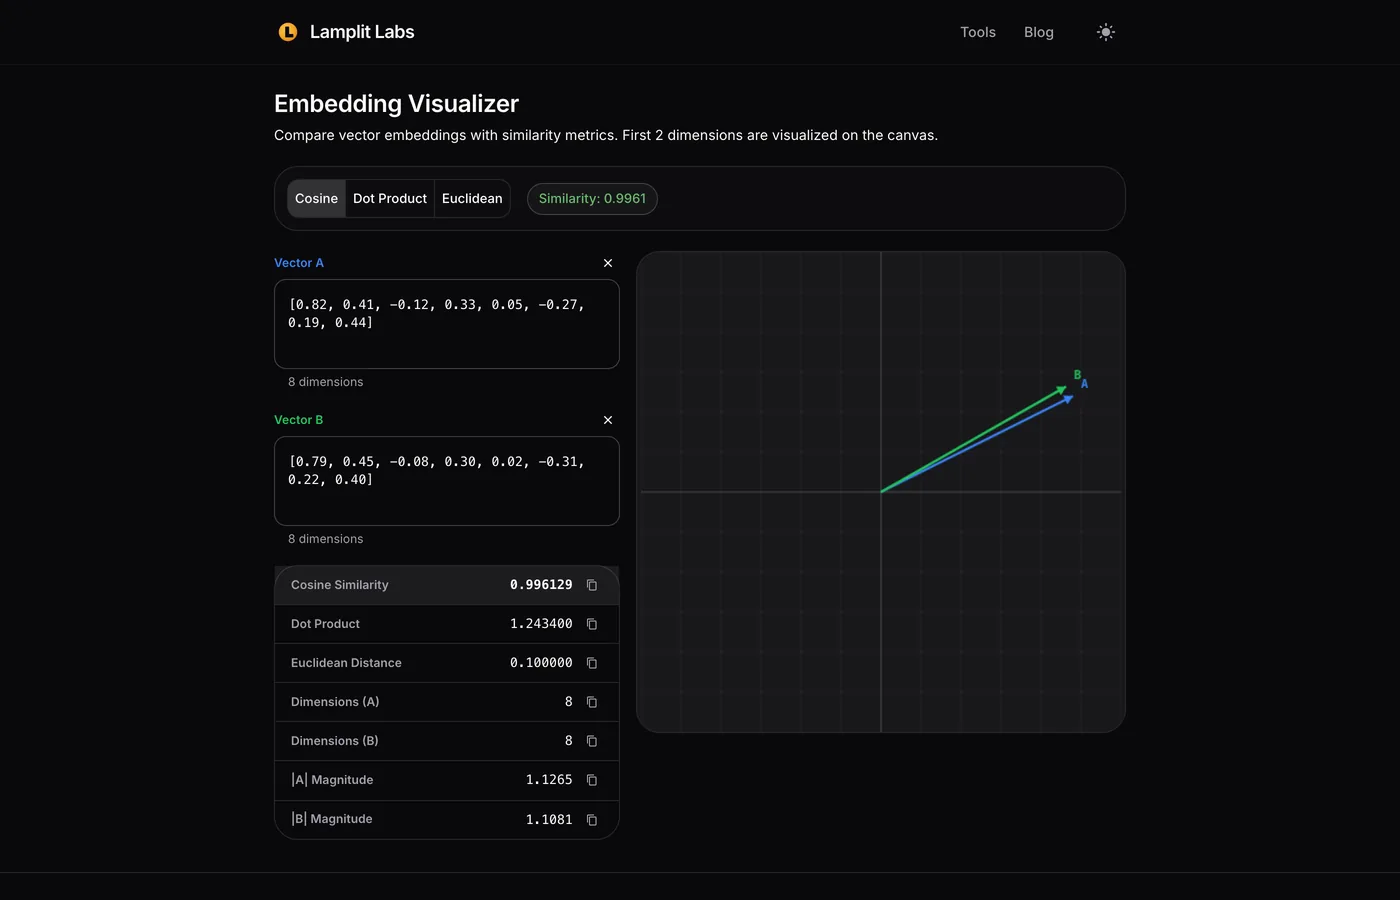
Cosine similarity comes out at 0.9961. The score is coloured by range, green above 0.8, amber between 0.5 and 0.8 and red below, which maps reasonably onto “near duplicate”, “related” and “probably not what you want” for most sentence-embedding models.
What the three metrics tell you
The tabs are not three views of the same number, and the reason to have all three in one place is that retrieval systems disagree about which one they use.
- Cosine similarity is the angle between the vectors, ignoring their length. It is what most vector databases default to and what most similarity thresholds in application code are written against. Two vectors that point the same way score 1 regardless of magnitude.
Dot product is cosine similarity multiplied by both magnitudes. For models that ship normalised embeddings (unit length) it is identical to cosine; for models that do not, a long vector will dominate the ranking, which is a common surprise when switching embedding providers. The magnitude readout under the score is there precisely so you can check whether your vectors are normalised: for the pair above, A is 1.1265 and B is 1.1081, so they are not, and dot product will not equal cosine. - Euclidean distance is the straight-line gap between the two points. Lower is closer, the scale depends on the dimensionality and magnitude of the model’s output, and it is what some older ANN indexes and clustering code use.
The second screenshot replaces Vector B with a vector that points in a different direction, with the Euclidean tab selected:
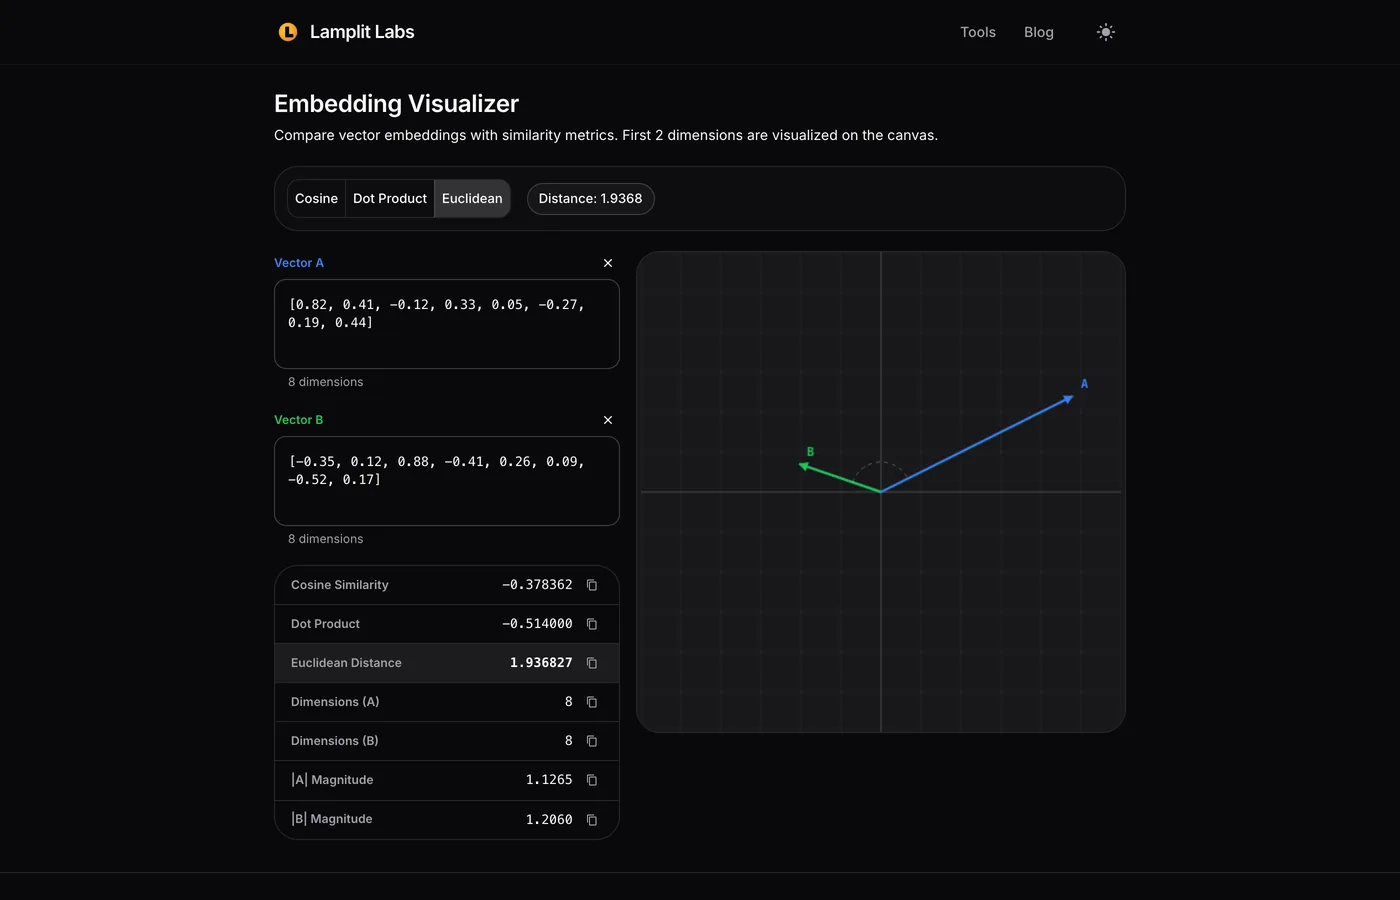
Distance is 1.9368 here against 0.1000 for the near-duplicate pair; switching back to the cosine tab gives -0.3784. Seeing both for the same pair is the quickest way to internalise that a threshold of 0.8 means something completely different depending on which tab your production code is implicitly on.
Catching a dimension mismatch
The error you will hit most often in practice is not a subtle score. It is two vectors from two different models, or the same model at two different dimensions settings, being compared as if they were compatible. The tool refuses and says why:
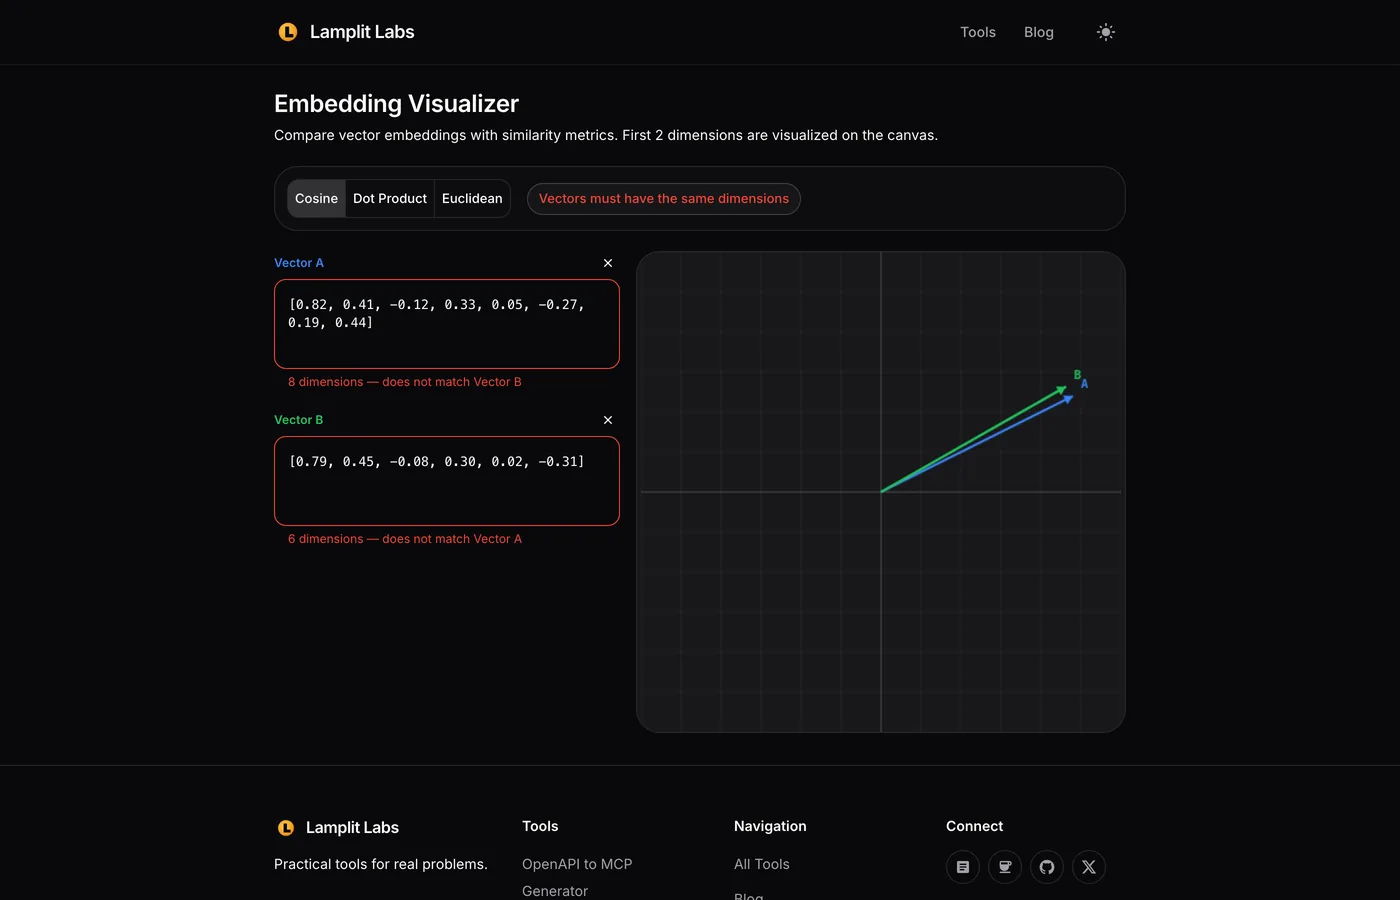
A vector store will usually reject the insert too, but it does so with a stack trace at indexing time, long after the embedding call that produced the wrong width. Pasting one row from the store and one fresh embedding from the client into the visualizer confirms in a few seconds whether the two sides of the pipeline agree on width.
What it deliberately does not do
- It does not call an embedding model. You bring the vectors; it does the arithmetic.
- It does not reduce dimensions. The canvas draws the first two components only, so it shows direction for small test vectors and is decorative for a 1536-wide one. The numbers are the result, not the picture.
- It compares exactly two vectors. For ranking a query against a batch, export from your store and use a notebook; this tool is for inspecting one comparison that looks wrong.
Where it fits in an AI SDLC
Similarity scores are the one place in a RAG system where the code is trivial and the semantics are not, so the visualizer earns its keep at review points rather than in the pipeline:
- Setting a threshold. Embed a handful of known-relevant and known-irrelevant pairs, paste them in, and write down the cosine scores before choosing a cut-off. A threshold picked from real pairs survives a model upgrade far better than one copied from a blog post.
- Debugging a bad retrieval. Pull the query vector and the vector of the passage that came back, and the vector of the passage that should have. If the wrong one really does score higher under cosine, the problem is the embedding or the chunking, not the index. If it does not, the index is using a different metric than you think.
- Switching providers. Before migrating, embed the same sentence with both models and check the magnitudes. Different normalisation is why a dot-product index that worked with one provider ranks nonsense with the next.
Together with the Text Chunker for what goes into the embedding and the Token Counter for how much of it fits, the Embedding Visualizer covers the step in between: making sure the number that decides what the model sees means what you think it means.