Enterprise AI: An Azure OpenAI On-Call Runbook - The Five Alerts That Page and the First Command for Each
An Azure OpenAI on-call runbook: the five alerts allowed to page, the first KQL or APIM check for each, and how MTTR fell from 74 to 23 minutes.
Three incidents in six weeks taught us that an Azure OpenAI gateway fails in ways a normal API does not. A 429 storm is not an outage, a content_filter spike is not a bug in our code, and a silent model-version change produces no error at all - just worse answers. Each time, the on-call engineer spent the first forty minutes working out which kind of problem they had.
This post is the runbook we wrote afterwards. It has five alerts, one first check per alert, and a measured result: mean time to resolve across 32 pages went from 74 minutes to 23.
Why a normal API runbook does not fit
Our existing runbook assumed symptoms map to causes: 5xx means the backend, latency means a slow dependency, 4xx means a client bug. Azure OpenAI breaks all three assumptions:
- 429 is capacity, not a client bug. Tokens-per-minute quota is per deployment and per region, so one noisy product can starve the others behind the same APIM gateway.
- 400 can be a policy outcome. A
content_filterresponse is the service doing what we configured. Fixing it means changing a prompt or a filter severity, not rolling back code. - No error at all can still be an incident. A model version auto-upgrade changes answer quality and token counts with a 200 status. We covered that gate in the model retirement post; here it becomes a page.
So the runbook is organised by alert, not by HTTP status.
The five alerts
Everything else is a dashboard tile, not a page. These five wake someone up.
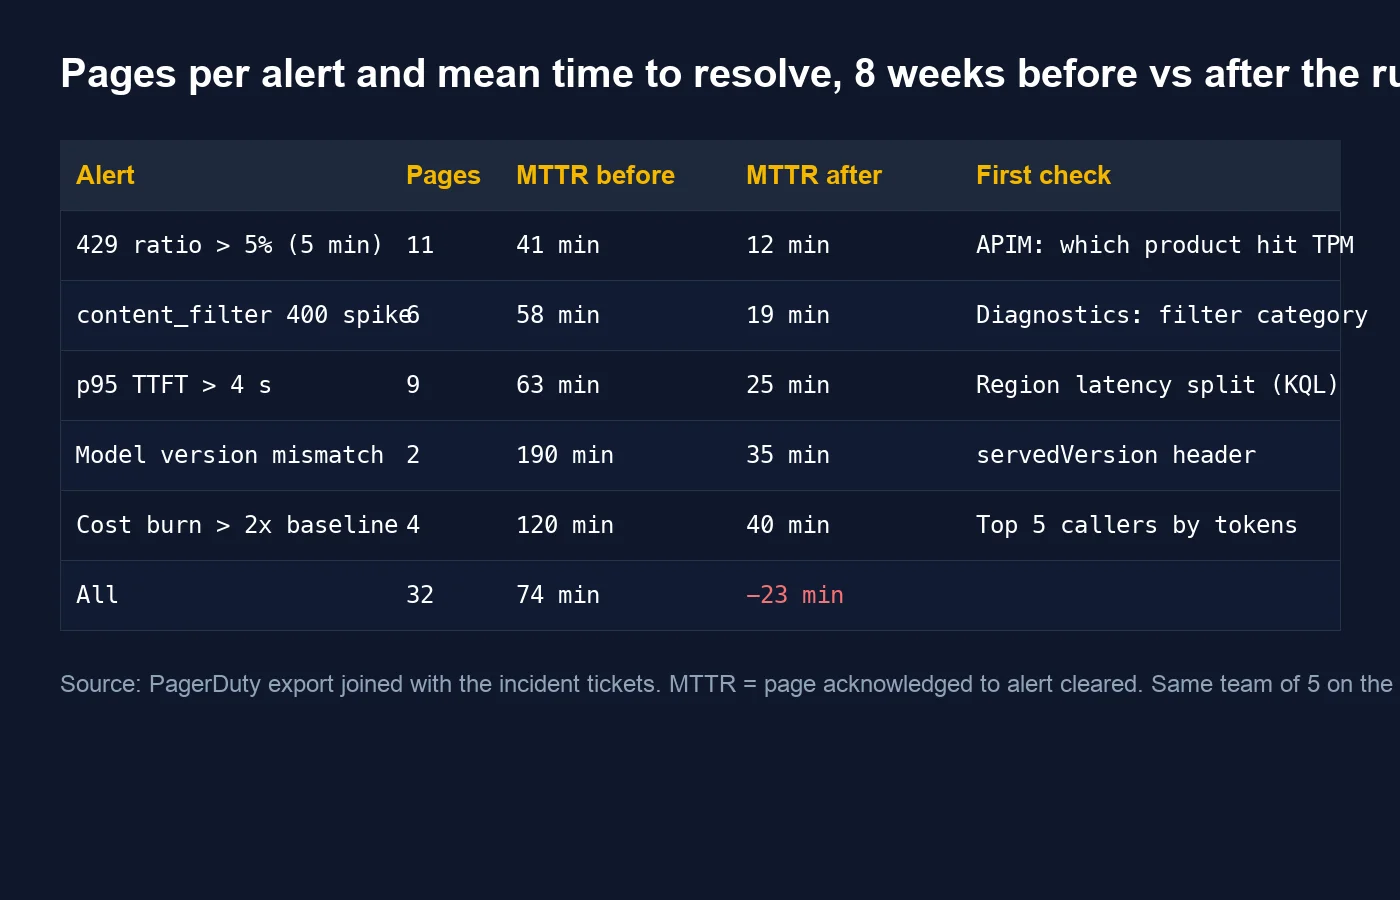 Pages per alert and MTTR over 8 weeks before and after the runbook. Same five-person rota, same PagerDuty service.
1. 429 ratio above 5% for 5 minutes
First check - which APIM product is burning the quota:
ApiManagementGatewayLogs
| where TimeGenerated > ago(15m)
| where ResponseCode == 429
| summarize Count = count() by ProductId, BackendId, bin(TimeGenerated, 1m)
| order by Count desc
If one product dominates, apply its per-product llm-token-limit policy (see token quotas and chargeback) rather than raising the deployment quota for everyone. If the 429s are spread evenly, the region is saturated - fail over to the secondary backend pool and check the retry behaviour in the 429 backoff post is not amplifying the storm.
2. content_filter 400 spike (more than 3x the hourly baseline)
First check - which category and which caller:
AzureDiagnostics
| where TimeGenerated > ago(30m)
| where ResourceProvider == "MICROSOFT.COGNITIVESERVICES"
| where properties_s has "content_filter"
| extend Category = extract(@"""(hate|sexual|violence|self_harm|jailbreak)""\s*:\s*\{[^}]*""filtered""\s*:\s*true", 1, properties_s)
| summarize count() by Category, CallerIpAddress, bin(TimeGenerated, 5m)
A single jailbreak category from one IP is an abuse event: block at APIM. The same category spread across callers after a deploy means a prompt change tripped the filter: roll back the prompt, not the service. Handling the response in code is covered in the content filter post.
3. p95 time-to-first-token above 4 seconds for 10 minutes
First check - is it one region or both:
ApiManagementGatewayLogs
| where TimeGenerated > ago(20m)
| where BackendId in ("aoai-westeurope", "aoai-swedencentral")
| summarize p95 = percentile(BackendResponseTime, 95) by BackendId, bin(TimeGenerated, 2m)
One slow region means the circuit breaker in the multi-region failover setup should already be shifting traffic; if it is not, trip it by hand. Both regions slow at once has always been our own fault so far - a prompt that grew by 3,000 tokens is the usual cause.
4. Served model version differs from the pinned version
The upgrade-gate policy sets a servedVersion header on every response. The alert fires when that header differs from the pinned value for more than 1% of requests in 15 minutes.
First check:
1
2
3
4
az cognitiveservices account deployment show \
  --name aoai-prod-weu --resource-group rg-ai-prod \
  --deployment-name gpt-4o-prod \
  --query "properties.{model:model.version, policy:versionUpgradeOption}"
If versionUpgradeOption is anything other than NoAutoUpgrade, someone redeployed the Bicep without the pin. Re-apply, then run the eval set before declaring it resolved. This is the alert with the worst “before” number (190 minutes) because nobody suspected a 200 response.
5. Cost burn above 2x the 7-day baseline for 30 minutes
First check - top callers by tokens in the last hour:
ApiManagementGatewayLogs
| where TimeGenerated > ago(1h)
| extend Tokens = toint(parse_json(ResponseHeaders)["x-total-tokens"])
| summarize TotalTokens = sum(Tokens), Calls = count() by ProductId, ApiId
| top 5 by TotalTokens
Twice this was a retry loop in a batch job calling the chat endpoint with the whole document in every attempt. Once it was legitimate load from a product launch nobody told platform about. The dashboard behind this alert is in the cost observability post; the burn-rate maths comes from the SLO post.
What changed the number
The MTTR drop is not from faster engineers. Three things did it:
- One first command per alert. Nobody opens a blank Log Analytics tab at 2 a.m. anymore.
- The alert names the kind of failure. “429 ratio” and “content_filter spike” are different pages with different runbook sections, instead of one “AOAI errors elevated” page.
- The model-version alert exists at all. The 190-minute incident was found by a user complaint. Now it pages inside 15 minutes.
The runbook lives in the repo next to the APIM policies, and the on-call rota reviews it after every incident. The next thing we add is an auto-remediation for alert 1: apply the per-product token limit automatically when one product exceeds 60% of the shared quota, and page only if the ratio stays high afterwards.
Related
- Enterprise AI: Cost and Latency SLOs for LLM Workloads - Burn-Rate Alerts for Azure OpenAI in Production
- Enterprise AI: Multi-Region Failover for Azure OpenAI with APIM Backend Pools and Circuit Breakers
- Handling 429 Rate Limits from Azure OpenAI in .NET: Backoff That Actually Works
- Azure OpenAI Content Filters in .NET: Handling finish_reason content_filter Without Breaking Your App
- Enterprise AI: A Cost Observability Dashboard for Azure OpenAI with Log Analytics, KQL and Workbooks